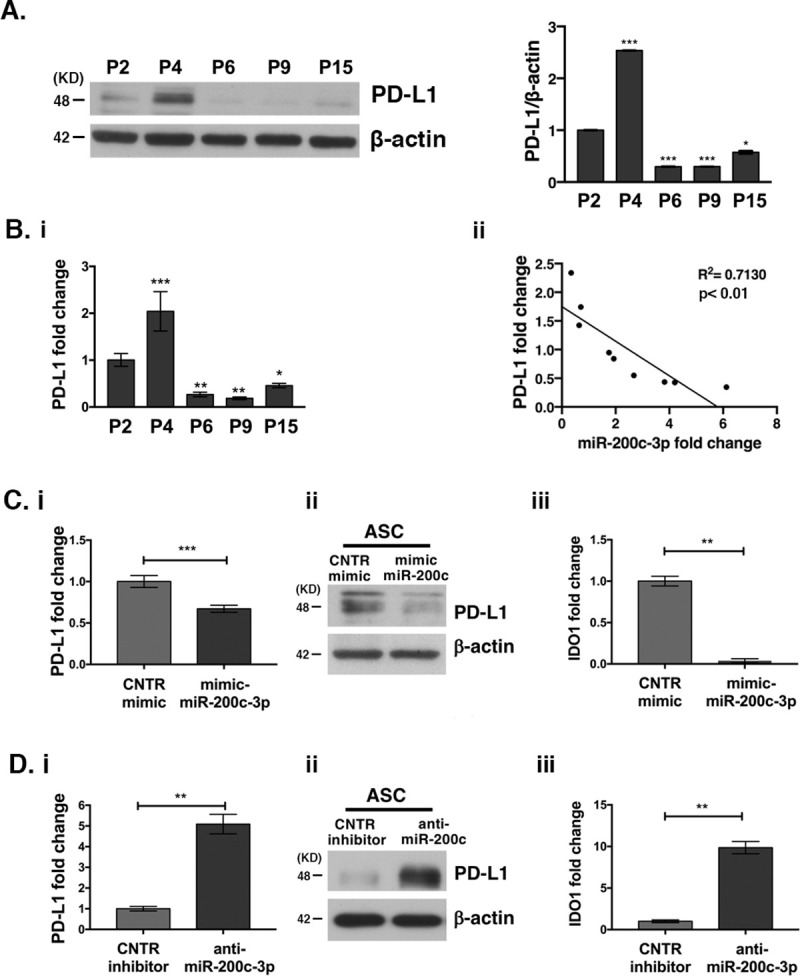
Fig 5. MiR-200c-3p inverse correlates with PD-L1 expression and modulates PD-L1 and IDO1 expression in ASCs.

A. PD-L1 expression at P2-P15 passages was assessed by WB. Densitometric analysis measures the fold change of PD-L1 expression normalized to β-actin in each passage. One out of two WBs is shown. Dunnett’s multiple comparisons test was applied to compare P2 with each of the passages. *p<0.05, ***p<0.001. B. (i): PD-L1 mRNA detection by QRT-PCR, during in vitro passages (P). PD-L1 expression was normalized to GAPDH. SD± are the mean of three independent experiments. Dunnett’s multiple comparisons test was applied to compare P2 with each of the passages. *p<0.05, **p<0.01, ***p<0.001. (ii): Correlation analysis between PD-L1 and miR-200c-3p expression was performed in ASCs derived from 5 healthy donors at all passages from 2 to 15. The square of the correlation coefficient, R2 <0.7 shows that the inverse correlation is significant with p<0.01. C. (i): PD-L1 transcript fold change by qRT-PCR in ASCs transfected with miR-200c-3p mimics, at P4 and (ii): PD-L1 protein detection by WB. (iii): IDO1 transcript fold change by qRT-PCR in ASCs transfected with miR-200c-3p mimics, at P4. D. (i): PD-L1 transcript by qRT-PCR in ASCs transfected with miR-200c-3p inhibitors, at P9 and (ii): PD-L1 protein detection by WB. and (iii): IDO1 transcript fold change by qRT-PCR in ASCs transfected with miR-200c-3p inhibitor, at P9. SD± is the mean of three experiments and the p values were calculated with two tailed unpaired t test. **p<0.01, ***p<0.001.
