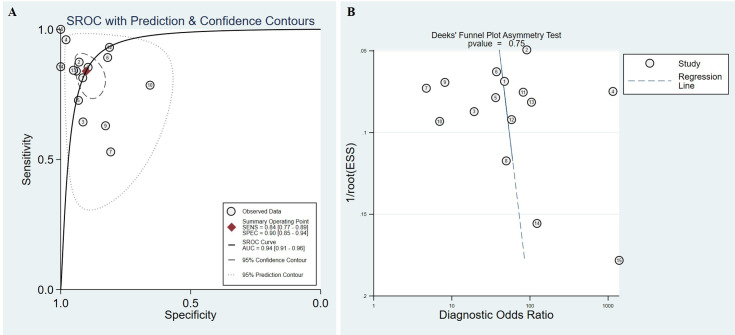
Fig 3. Summary ROC analysis.
(A) Summary ROC for the evaluation of prediction efficacy of TRIM59, with confidence and prediction regions around mean operating sensitivity and specific point. The ID in the figure corresponds to the projects in Table 1. (B) Deeks’ funnel plot asymmetry test showing the potential publication bias. The ID in the figure corresponds to the projects in Table 1.

