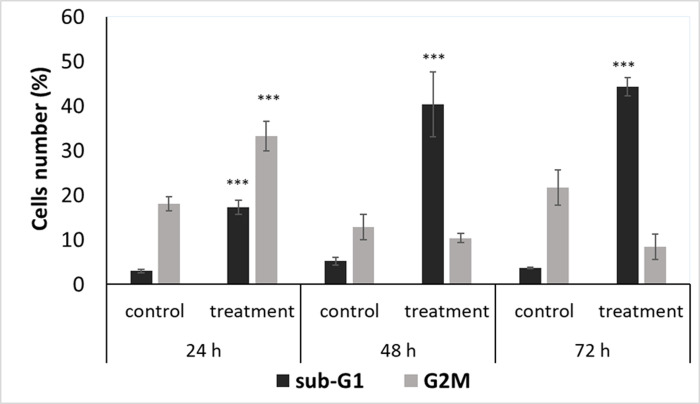
Fig 2. Cell cycle analysis of FaDu cells following 5-AzaD treatment.
FaDu cells were treated with 5 μM of 5-AzaD for 24, 48 and 72 h; Untreated FaDu cells (control) were exposed to 0.01% DMSO. Cells were subjected to cell cycle analysis by flow cytometry as described under “Materials and methods”. The graph summarize percentages of cells in sub-G1 and G2/M phases following treatment. The results are presented as mean ± SD of four experiments each conducted in duplicates and are expressed as percentages from total of 10,000 analysed cells. Statistical significance was determined by two-tailed student’s t-test (treatment VS. control) and is indicated as *p < 0.05; **p < 0.01; ***p < 0.001.

