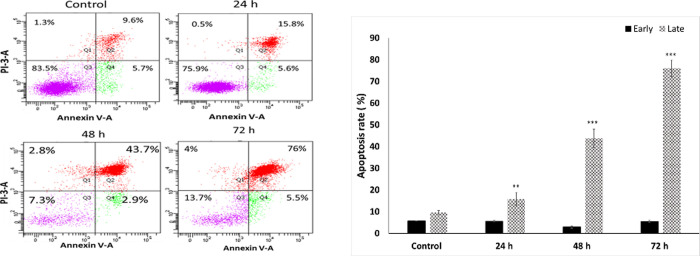
Fig 3. Measurement of apoptotic cells using an Annexin V binding.
FaDu cells were treated with 5 μM of 5-AzaD for 24, 48, 72 h. Untreated FaDu cells were exposed to 0.01% DMSO. Analysis of Annexin V-FITC/PI double-stained was performed using flow cytometry. In a representative plot (A), the power left quadrant (Q3) represents viable cells, the upper left quadrant (Q1) indicates necrotic cells, the lower right quadrant (Q4) denotes early apoptotic cells and the upper right quadrant (Q2) represents late apoptotic cells. The percentage of Annexin V-FITC positive cells from the early and late stage of apoptosis following treatment for 24, 48 and 72h is shown. Data are presented as mean ± SE of three independent experiments, each conducted in duplicates [mean (B)]. Statistical significance was determined by two-tailed student’s t-test [treatment vs. control (untreated cells)] and is indicated as **p < 0.01, ***p < 0.001.

