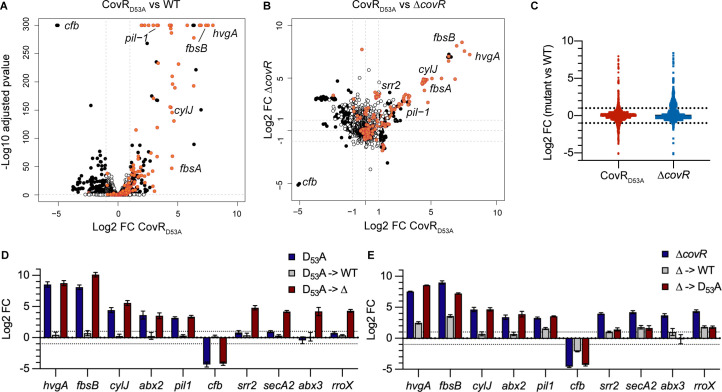
Fig 1. The CovR regulon in the hypervirulent BM110 strain.
(A) Volcano plot of the BM110 CovRD53A transcriptome at mid-exponential phase in THY. Each dot represents one of the 2178 genes with its RNA-seq fold change and adjusted p-value (Wald test) calculated from three independent replicates. Black and white dots symbolized significant (|Log2 FC| > 1; adjusted p-value < 0.005) and non-significant differentially transcribed genes, respectively. Red dots are genes associated to a CovR binding region identified by ChIP-Seq (see Fig 2), with selected gene names highlighted. (B) Pairwise comparisons of the BM110 CovRD53A and ΔcovR mutant transcriptomes. Each dot has the same color-coded as in (A), corresponding to significant vs non-significant differential gene expression in the CovRD53A mutant. Dots dispersion represents mutant-specificities. (C) Dot plots of RNA-seq fold changes for all genes in the ΔcovR (blue) and CovRD53A (red) mutants. Note the opposite trends in the total number of mild up-regulated genes (1 < log2 FC < 3) in the ΔcovR mutant and of down-regulated genes (-3 < log2 FC < -1) in the CovRD53A mutant. (D) Validation of gene expression by qRT-PCR in the CovRD53A mutant (D53A), the chromosomally complemented strain (D53A->WT), and in a ΔcovR mutant done in the CovRD53A background (D53A->Δ). (E) Validation of gene expression by qRT-PCR in the ΔcovR mutant (Δ), the chromosomally complemented strain (Δ->WT), and in a CovRD53A mutant done in the ΔcovR background (Δ->D53A). Means and standard deviations of log2 fold change (mutant versus WT) are calculated from three biological replicates.

