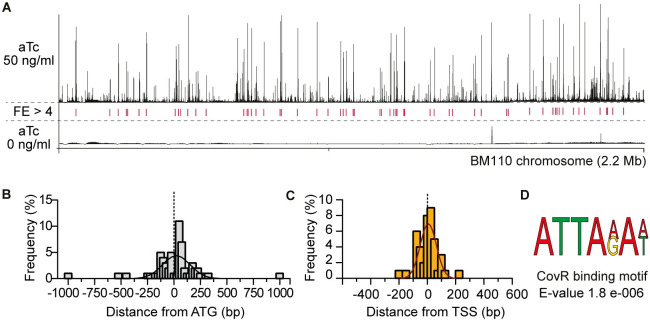
Fig 2. Whole-genome CovR binding on the BM110 genome.
(A) ChIP-seq profile of CovR on the BM110 chromosome. Sequence reads were mapped on the chromosome after induction of the epitope-tagged FLAG-CovR with 50 (upper panel) or 0 ng/ml (bottom panel) anhydrotetracycline (aTc) in a ΔcovR mutant. Peak height represents the mean coverage at each base pair of two independent ChIP-seq experiments. Loci with significant fold enrichment (FE > 4, IDR < 0.05) are indicated by red lines. (B) Distribution of the distance between each CovR binding peak and the nearest start codon. Distances were calculated from the summit of each CovR peak. The histogram represents the proportion of CovR binding sites (N = 62) in each sliding window of 25 bp, with an additional fitting curve. (C) Distribution of the distance between each CovR binding peak and the nearest transcriptional start site. Calculated as for (B). (D) Predicted CovR binding consensus sequence. Sequence enrichment in the 62 CovR binding loci (100 bp each) identified with the DREME software [86].

