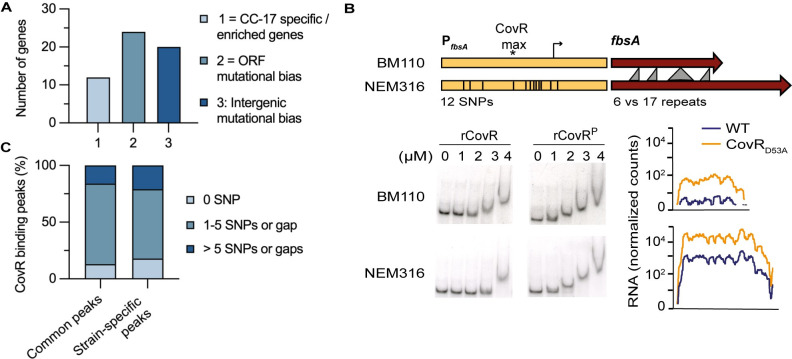
Fig 4. Adaptation of CovR signaling in the hypervirulent lineage.
(A) Histogram reporting the number of CovR binding loci on the BM110 chromosome associated with CC-17 specific or enriched genes (category 1), with genes showing a mutational biases indicative of adaptive evolution (category 2), and in intergenic regions with mutational biases suggestive of CovR rewiring in CC-17 (category 3). The ORFs and intergenic mutational biases in the whole GBS population have been previously calculated to reconstitute the evolution of the CC-17 hypervirulent lineage [4] and the detailed list with gene IDs is in S4 Table. (B) CovR regulation of the FbsA adhesin encoding gene in BM110 (CC-17) and NEM316 (CC-23) strains. Schematic representation of the fbsA gene (dark red) and promoter (yellow) in the two strains showing the gene length difference leading to the translation of a protein with a different number of a repeated motif, and the 12 SNPs in the promoter region (336bp). Bottom: binding of non-phosphorylated and phosphorylated rCovR to the two promoters by EMSA and normalized RNA-seq data for the two WT strains and their corresponding CovRD53A mutants. Note that the two strains differ by their basal level of fbsA transcription and not by CovR binding or regulation. (C) Promoters mutations in direct CovR regulated genes. Cumulative percentage of CovR binding loci (250 bp centered on the maximum ChIP-seq signal) with 0 (black), up to five (grey) or more than five SNPs or gaps (white) between BM110 and NEM316 sequences. Common peaks = CovR binding loci detected in BM110 and NEM316; Strain-specific peaks = CovR binding loci detected in one strain only. Sequences alignment was performed by blastn.

