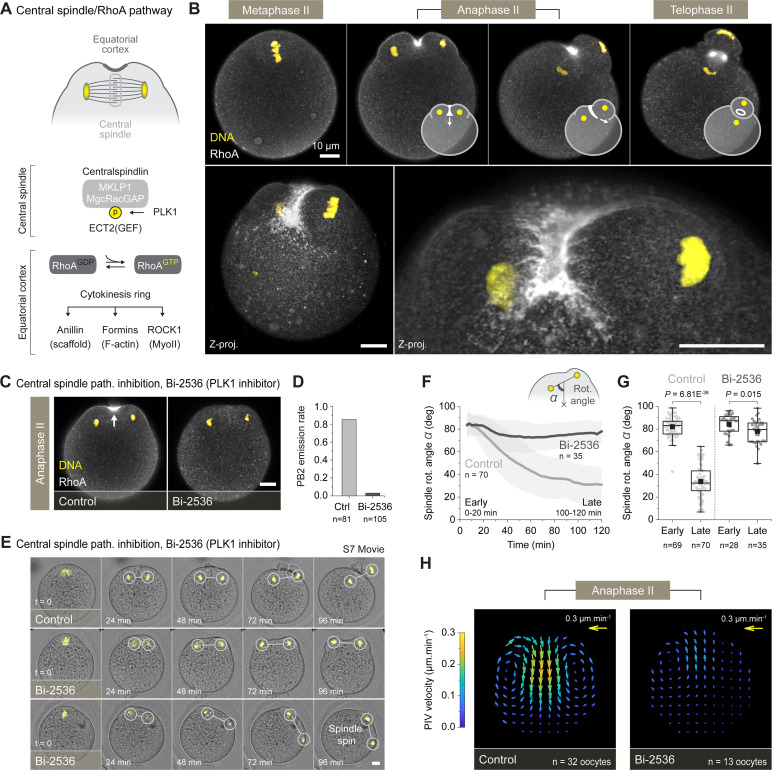
Fig 2. The central spindle/RhoA pathway is required for spindle rotation.
(A) Simplified diagram of the central spindle pathway leading to the activation of the RhoA GTPase and the assembly of the cytokinesis ring. (B) Fixed RhoA (immunostaining) and DNA (To-Pro-3) imaging of differentially staged oocytes undergoing spindle rotation. The top panel shows single confocal planes with superimposed diagrams illustrating the progressive closure of the cytokinesis ring. The bottom panels represent maximum intensity z-projections of multiple confocal planes to better visualize the hemi-ring distribution of RhoA. (C) Inhibiting the central spindle pathway, using the Bi-2536 (PLK1 inhibitor), prevented the recruitment of RhoA and the cortical ingression (see white arrow). Fluorescence patterns shown in C were consistently observed in 33 control and 25 Bi-2536–treated oocytes, both gathered from 3 independent experiments. (D) PB2 emission rate in 81 control and 105 Bi-2536–treated oocytes, both gathered from 4 independent experiments. (E) Live imaging of activated control and Bi-2536–treated oocytes (S7 Movie). The oocytes were injected with the H2B-mCherry DNA marker. Among the Bi-2536–treated oocytes, about one-third (n = 10/35 approximately 29%) of the spindles engaged in a spin around the cell periphery, while the others (n = 25/35 approximately 71%) simply remained parallel to the cortex. (F) Averaged variation over time ± SD of the spindle rotation angle α in control and Bi-2536–treated oocytes. (G) Box plots showing the distribution of early (0–20 min) and late (100–120 min) spindle rotation angle α in control and Bi-2536–treated oocytes. Measurements in F and G were performed on 70 control and 35 Bi-2536–treated oocytes, gathered respectively from 9 and 6 independent experiments. (H) PIV vector fields showing the averaged cytoplasmic streaming pattern in 32 control and 13 Bi-2536–treated oocytes, both gathered from 5 independent experiments. Box plots in G extend from the first (Q1) to the third (Q3) quartile (where Q3–Q1 is the IQR); whiskers are Q1 or Q3 ± 1.5 × IQR; horizontal lines represent the median; and black squares represent the mean. p-values in G were obtained using a two-sided Mann–Whitney test. Data underlying this figure can be found in S1 Data. Scale bars = 10 μm. IQR, interquartile range; PB2, second polar body; PIV, particle image velocimetry; PLK1, Polo-like kinase 1; ROCK1, Rho-associated protein kinase 1.

