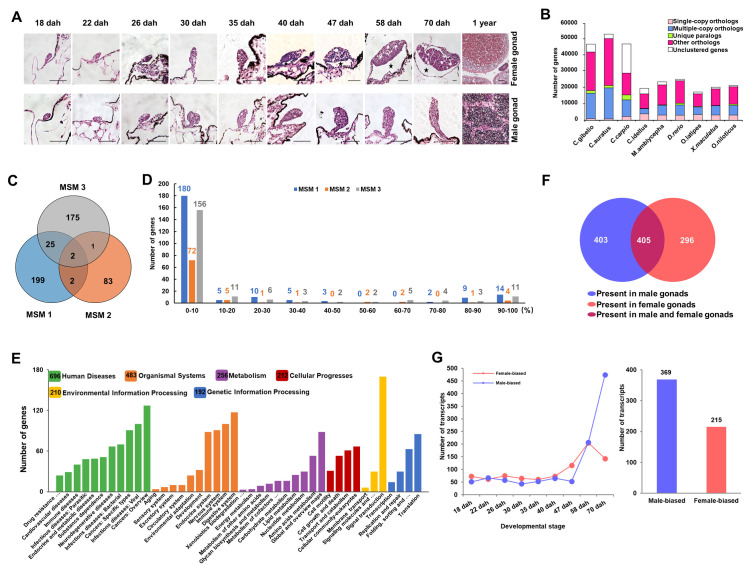
Fig 5. Identification of genes and the corresponding transcripts.
(A) The hematoxylin-eosin staining of genotypic female and male gonads at 10 developmental stages. Scale bar = 50 μm. (B) The distribution of different types of gene families among nine species. The X axis shows nine species and the Y axis indicates the number of genes. (C) Numbers of identified genes on MSM 1, MSM 2 and MSM 3. (D) Results of gene integrity analysis. X axis indicates each integrity percentage bins and Y axis shows the number of genes. (E) KEGG analysis of the MSM-linked transcripts. (F) The distribution of MSM-linked transcripts in male and female gonads. (G) Sex-biased transcripts during the early stages of gonadal development. Dah, days after hatch.

