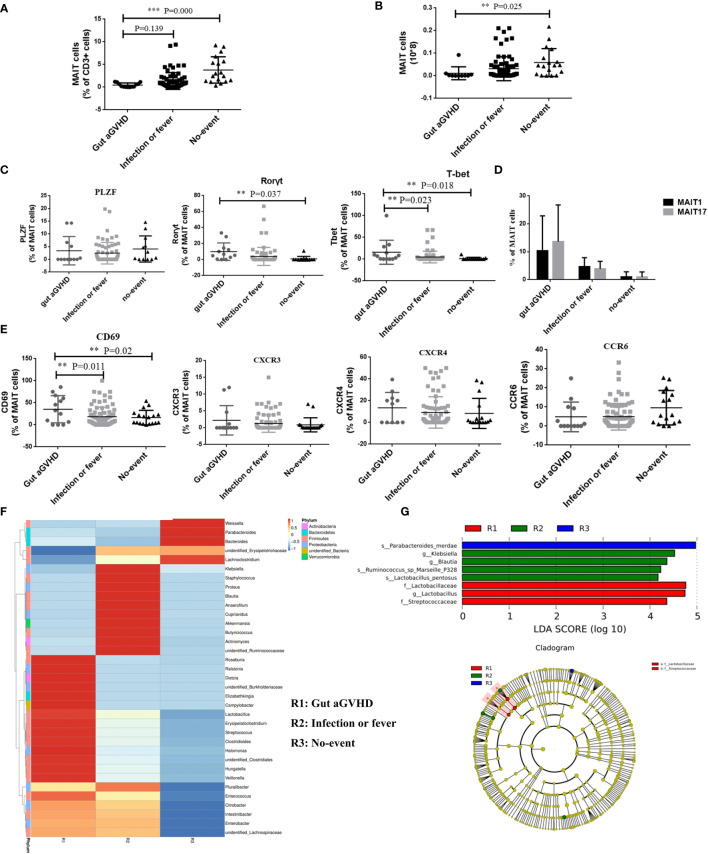
Figure 6.
The comparison of the number and function of mucosa-associated invariant T (MAIT) cells among patients with gut acute graft-versus-host disease (aGVHD) (n = 16), patients with infection or fever (n = 38) at the same time, and patients with no-event (n = 19) at the same time. (A) The comparison of the frequency of MAIT cells among gut aGVHD group, infection or fever group, and no-event group (Frequency: Gut aGVHD vs. No-event, p < 0.001). (B) The comparison of the number of MAIT cells among gut aGVHD group, infection or fever group, and no-event group (Number: Gut aGVHD vs. No-event, p = 0.025). (C) The comparison of T-bet+ MAIT (MAIT1) and Rorγt+ MAIT (MAIT17) among the three groups. (D) The comparison of the transcription factors among the three groups (Rorγt: Gut aGVHD vs. No-event, p = 0.037; T-bet: Gut aGVHD vs. No-event, p = 0.018; Gut aGVHD vs. Infection or fever, p = 0.023). (E) The comparison of the chemokine factors and markers among the three groups (Gut aGVHD vs. No-event, p = 0.02; Gut aGVHD vs. Infection or fever, p = 0.011). (F) Cluster heat map of species abundance at the genus level. (G) LDA score distribution histogram and cladogram. Levels of significances are given as p-values with ***≤0.01 and **≤0.5.

