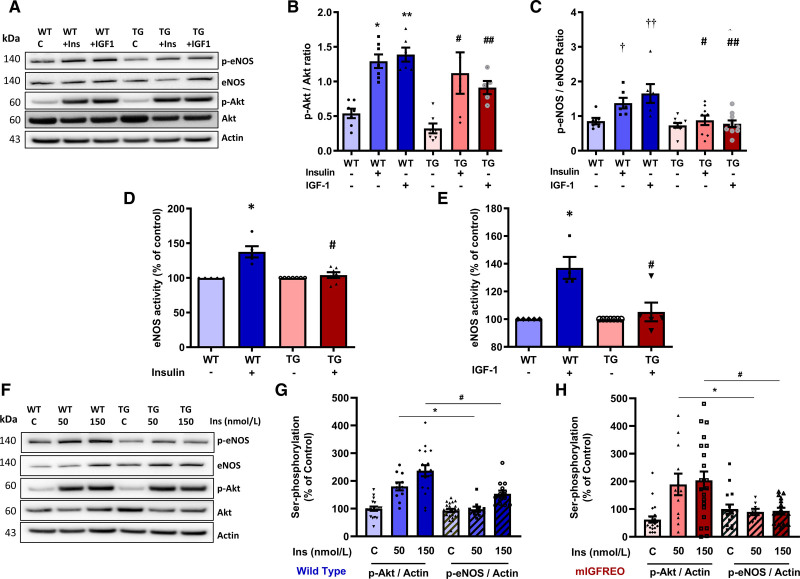
Figure 4.
mIGFREO (mutant IGF-1R EC overexpressing) mice had blunted eNOS (endothelial NO synthase) phosphorylation while sustained Akt (protein kinase B) phosphorylation in response to insulin or IGF-1.A, Representative blots for B and C. B and C, Insulin (Ins; 150 nM, 10 min) and IGF-1 (IGF-1; 150 nM, 10 min) stimulated Akt (B; WT [wild type], n=7; mIGFREO, n=7), eNOS (C; WT, n=6; mIGFREO, n=9) serine phosphorylation in WT and mIGFREO pulmonary endothelial cell (PEC). D and E, eNOS activity in WT and mIGFREO (TG) PEC upon insulin (150 nM, 30 min; D; WT, n=5; mIGFREO, n=7) and IGF-1 (150 nM, 30 min; E; WT, n=5; mIGFREO, n=7) stimulation. F, Representative blots for G and H. G and H, Dose-dependent response to insulin (Ins; 50, 150 nM, 10 min) induced serine phosphorylation of Akt and eNOS in WT endothelial cells (PEC; G; WT, n=21; mIGFREO, n=22). Dose-dependent response to insulin (Ins; 50, 150 nM, 10 min) induced serine phosphorylation of Akt and eNOS in mIGFREO endothelial cells (H; WT, n=21; mIGFREO, n=22). mIGFREO/TG denotes mutant human IGF1-R transgenic mice. Data expressed as mean±SEM (B: *P<0.05, control vs insulin-stimulated Akt phosphorylation; **P<0.05, control vs IGF-1–stimulated Akt phosphorylation in WT littermates; #P<0.05, control vs insulin-stimulated Akt phosphorylation; ##P<0.05, control vs IGF-1–stimulated Akt phosphorylation in mIGFREO cells. C: †P<0.05, control vs insulin-stimulated eNOS phosphorylation; ††P<0.05, control vs IGF-1–stimulated eNOS phosphorylation in WT cells; #P<0.05, WT+insulin vs TG+insulin for eNOS phosphorylation; ##P<0.05, WT+IGF-1 vs TG+IGF-1 for eNOS phosphorylation. D and E: *P<0.05, WT control vs WT+insulin or WT control vs WT+IGF-1; #P<0.05, WT+insulin vs TG+insulin or WT+IGF-1 vs TG+IGF-1. G and H: *P<0.05, serine phosphorylation of Akt or eNOS at 50 nmol/L insulin in WT or mIGFREO; #P<0.05 serine phosphorylation of Akt or eNOS at 150 nmol/L insulin in WT or mIGFREO). Data in B–H were analyzed using 1-way ANOVA, followed by Fisher test.

