Figure 7.
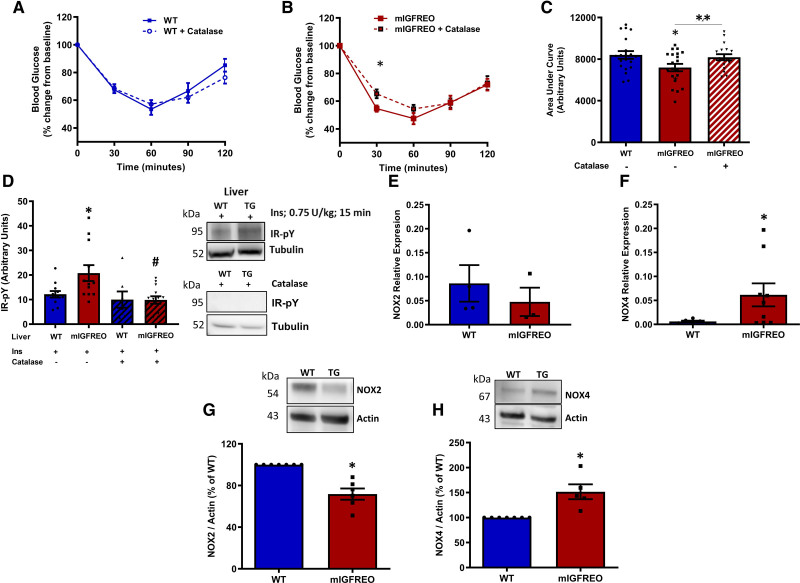
Excess generation of hydrogen peroxide in mIGFREO (mutant IGF-1R EC overexpressing) mice.A and B, Insulin tolerance testing after catalase infusion in WT (wild type; A) and mIGFREO (B) mice (WT, n=17; mIGFREO, n=20). C, Area under the curve for ITT presented in A and B showing mead data for WT, mIGFREO, and mIGFREO postcatalase infusion (10 000 U/kg per day; 5 d; WT, n=18; mIGFREO, n=21; D; WT, n=12; mIGFREO, n=12) Tyrosine phosphorylation of IR (insulin receptor) upon insulin stimulation (Ins; 0.75 U/kg, 15 min) with and without catalase infusion in liver (n=8; representative blots shown on the right). E and F, Relative mRNA expression of Nox2 (E; WT, n=3; mIGFREO, n=4) and Nox4 (F; WT, n=6; mIGFREO, n=9) in endothelial cells of mIGFREO and WT littermates. G and H, Protein expression of Nox2 (G; WT, n=7; mIGFREO, n=6) and Nox4 (H; WT, n=7; mIGFREO, n=5) in endothelial cells of mIGFREO and WT littermates. Data expressed as mean±SEM. B, *P<0.05 mIGFREO vs mIGFREO+catalase. C, **P<0.05 mIGFREO vs mIGFREO+catalase. D, *P<0.05, WT vs mIGFREO; #P<0.05 mIGFREO vs mIGFREO+catalase. F–H, *P<0.05 WT vs mIGFREO. Data in A and B were analyzed using multiple t test. Data in C and D were analyzed by 1-way ANOVA with Fisher test. Data in E were analyzed using unpaired Student t test. All others were analyzed using unpaired Student t test and Mann-Whitney U test.

