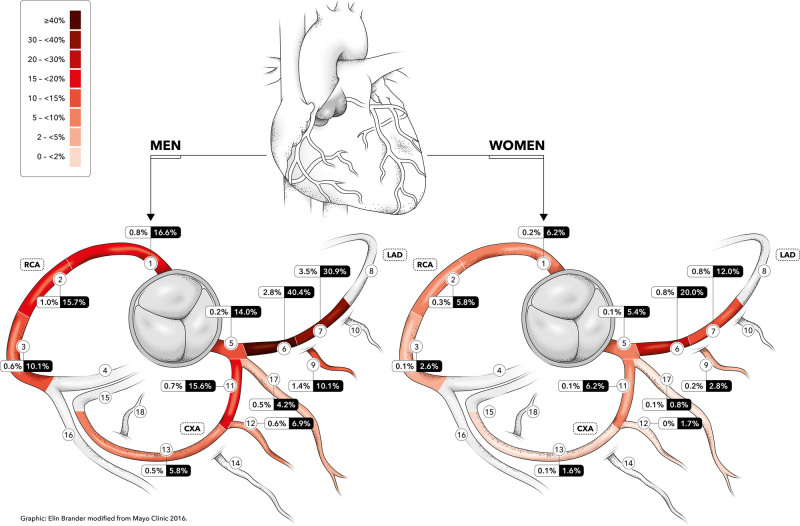
Figure 2.
Distribution of coronary computed tomography angiography–detected atherosclerosis. Frequency of atherosclerosis in the 11 most proximal coronary segments in men (n=12 444) and women (n=12 738) in the SCAPIS cohort (Swedish Cardiopulmonary Bioimage Study). The heat map refers to the frequency of any form of coronary computed tomography angiography–detected atherosclerosis. The numbers within boxes indicate the frequency of different degrees of vessel stenosis (white box, ≥50% stenosis; black box, any form of coronary computed tomography angiography–detected atherosclerosis). Figure modified from Ayoub et al.,52 used with permission of Mayo Foundation for Medical Education and Research, all rights reserved.

