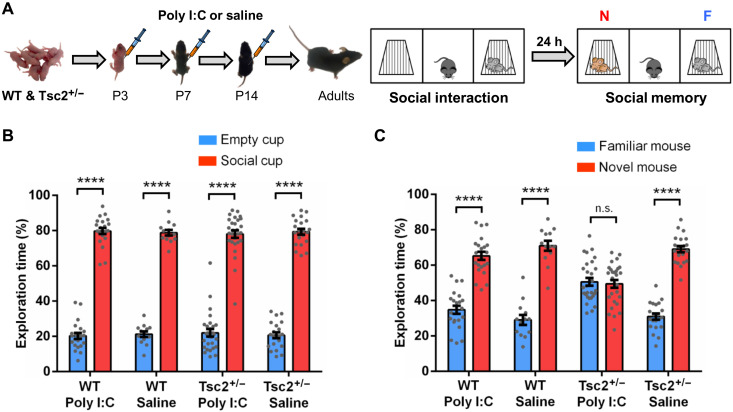
Fig. 1. Early postnatal immune activation triggers social memory deficits in adult Tsc2+/− male mice.
(A) Timeline of injections of Poly I:C or saline and behavior approach. N, novel mouse; F, familiar mouse. (B) Graph shows the % of time that male mice spent actively exploring the empty and the social cups. WT/Poly I:C (n = 22; P < 0.0001, t = 24.72), WT/saline (n = 13; P < 0.0001, t = 25.74), Tsc2+/−/Poly I:C (n = 28; P < 0.0001, t = 18.75), and Tsc2+/−/saline mice (n = 21; P < 0.0001, t = 24.90) show normal social interaction (they explore significantly more the social cup than the empty cup). Analyses of the data using two-way analysis of variance (ANOVA) revealed no significant differences between groups. (C) Graph shows the % of time that male mice spent actively exploring the cups with the familiar mouse and the novel mouse. WT/Poly I:C (n = 22; P < 0.0001, t = 9.43), WT/saline (n = 13; P < 0.0001, t = 10.35), and Tsc2+/−/saline mice (n = 13; P < 0.0001, t = 15.34) show normal social memory (they explore significantly more the novel mouse than the familiar mouse), but Tsc2+/−/Poly I:C (n = 28; P = 0.715, t = 0.36) mice show social memory deficits (show no preference for the novel mouse). Two-way ANOVA analyses using time spent exploring the novel mouse as the dependent variable revealed a significant treatment × genotype interaction [F(1,80) = 8.68, P = 0.0042], and Sidak post hoc test revealed a simple main effect of genotype on the Poly I:C group (P < 0.0001, t = 5.33). Data represent means ± SEM as well as values for individual mice.

