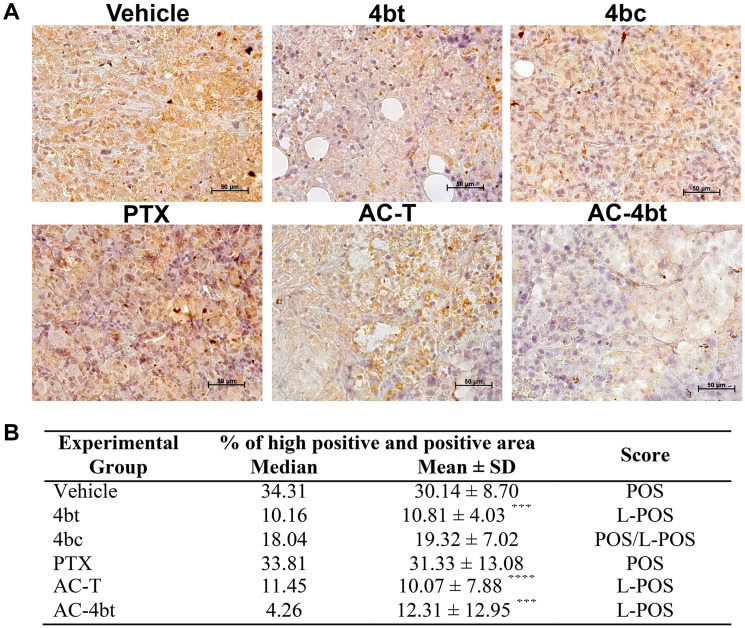
Figure 6. ALDH1-A1 expression analysis in tumor sections of xenografted Balb-c/nude mice.
(A) Representative images of ALDH1-A1 immunostaining of tumor sections from the different experimental groups administered intraperitoneally (i.p.) with: Vehicle, 4bt (80 mg/Kg), 4bc (80 mg/Kg), paclitaxel (20 mg/Kg), Doxorubicin (10 mg/Kg) + Cyclophosphamide (100 mg/Kg) followed by paclitaxel (10 mg/Kg) (AC-T) and Doxorubicin (10 mg/Kg) + Cyclophosphamide (100 mg/Kg) followed by KIF11 inhibitor 4bt (AC-4bt). (B) Quantitative analyses highly positive and positive area with indication of the score for each experimental group. L-POS: low positive; POS: positive. Data represent mean ± SEM of three independent experiments. *** p < 0.001, **** p < 0.0001 as compared to control group (vehicle). Bars: 50 μm.

