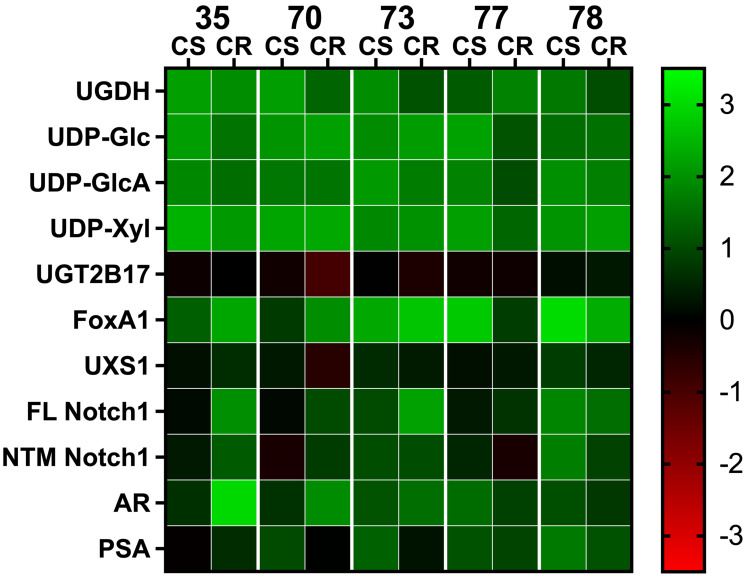
Figure 1. Comparative analysis of gene expression and metabolite levels in PDX tissue.
Changes in gene expression and metabolite levels among the LuCaP PDX models are plotted in a heat map using a double log scale. Colors indicate changes in gene expression or metabolite levels relative to LNCaP tumors grown in mice. On the scale, green denotes an increase in protein or metabolite; red denotes a decrease. Abbreviation: CS: castration sensitive; CR: castration resistant. Numbers indicate respective PDX models summarized in Table 2.

