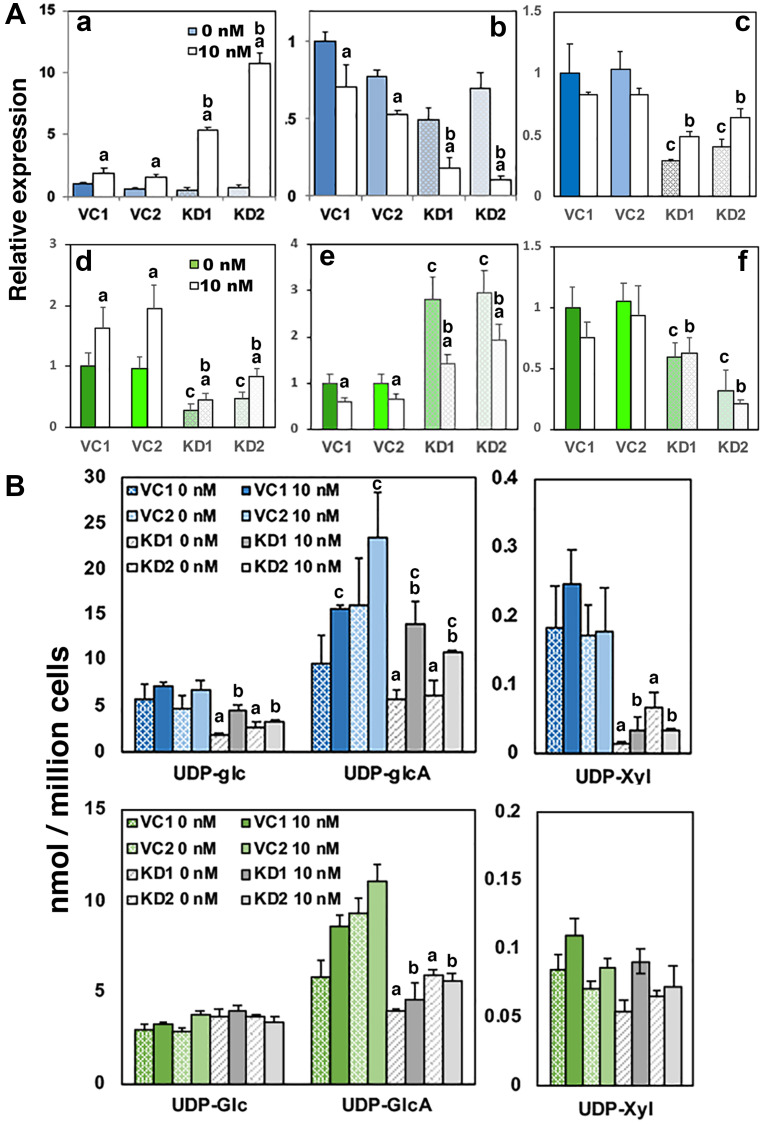
Figure 5. Loss of UGDH promotes AR-dependent gene expression and reduces proteoglycan production while sustaining glucuronide output.
LNCaP AD and CR cells were selected for stable expression of a non-targeting vector control (VC1 and VC2) or a UGDH shRNA knockdown construct (KD1 and KD2). Equal cell counts were seeded 48 hours in androgen depleted media, followed by removal and replacement with media containing 10 nM DHT or DMSO (vehicle, 0 nM). After an additional 48 hours, cells were harvested for analysis by western blot and mass spectrometry. (A) AR-dependent genes PSA (panels a and d) and UGT2B17 (panels b and e) were analyzed by WB in whole cell lysates; functional synthetic output of each cell line was assessed by Notch1 expression in cell lysates (panels c and f). Panels (a–c) depict expression data in the AD background and panels (d–f) illustrate data from the CR background. Mean ± SEM is plotted. Statistical significance is indicated on the plots as: (a) p < 0.05 for that clone, comparing 0 vs 10 nM DHT; (b) p < 0.05 relative to VC1 and VC2, 10 nM DHT; (c) p < 0.05 relative to VC1 and VC2, 0 nM DHT. (B) UDP-sugar pools were measured in cell lysates by LC-MS for both the AD (upper) and CR (lower) backgrounds as indicated. Mean ± SD is plotted. Statistical significance is indicated as: (a) p < 0.05 for both KD1 and KD2 relative to VC1 or VC2, 0 nM DHT. (b) p < 0.05 for both KD1 and KD2 relative to VC1 or VC2, 10 nM DHT. (c) p < 0.05 for that clone, comparing 0 and 10 nM DHT.

