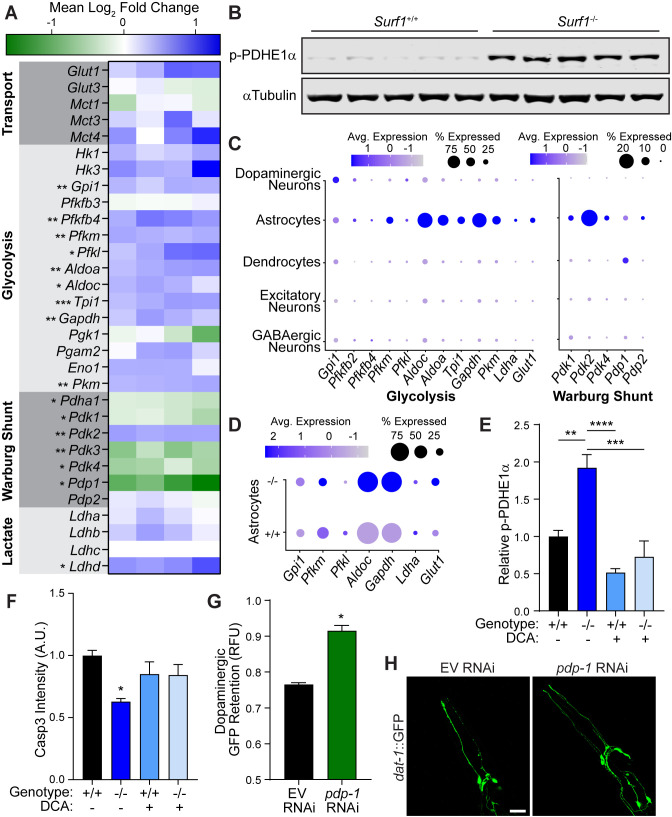
Figure 5. Impaired cytochrome C oxidase increases glycolysis in astrocytes through a Warburg-like effect.
(A) Heat map of transcriptional differences in Surf1+/+ versus Surf1-/- brains. n=4. Significance denoted next to gene. (B) Western blots of phosphorylated PDHE1α at Ser293 and αTubulin from Surf1+/+ and Surf1-/- brains, 7 days post-injury. (C) Dot plot of single nuclei RNAseq of glycolytic and Warburg-related genes in neuronal cell subtypes from Surf1+/+ and Surf1-/- brains. (D) Dot plot of single nuclei RNAseq of glycolytic genes in astrocytes from Surf1+/+ and Surf1-/- brains. (E) Quantification of phosphorylated PDHE1α at Ser293 and αTubulin from Surf1+/+ and Surf1-/- brains after NaCl and dichloroacetate (DCA) treatment. (F) Quantification of cleaved caspase-3 immunostaining in NaCl and DCA treated Surf1+/+ (n=3) and Surf1-/- (n=4) brains 7 days post-injury. (G) Post-trauma retention of GFP fluorescence in dopaminergic neurons of C. elegans treated with pdp-1 RNAi and measured by large-particle flow cytometry. n=1758 worms (EV RNAi), n=2307 worms (pdp-1 RNAi) across two independent trials. (H) Representative micrographs of GFP dopaminergic neuronal morphology in injured C. elegans treated with pdp-1 RNAi. Scale bar=20 μm. Data are mean ± SEM. *p ≤ 0.05, **p ≤ 0.01, ***p ≤ 0.001, and ****p ≤ 0.0001.


