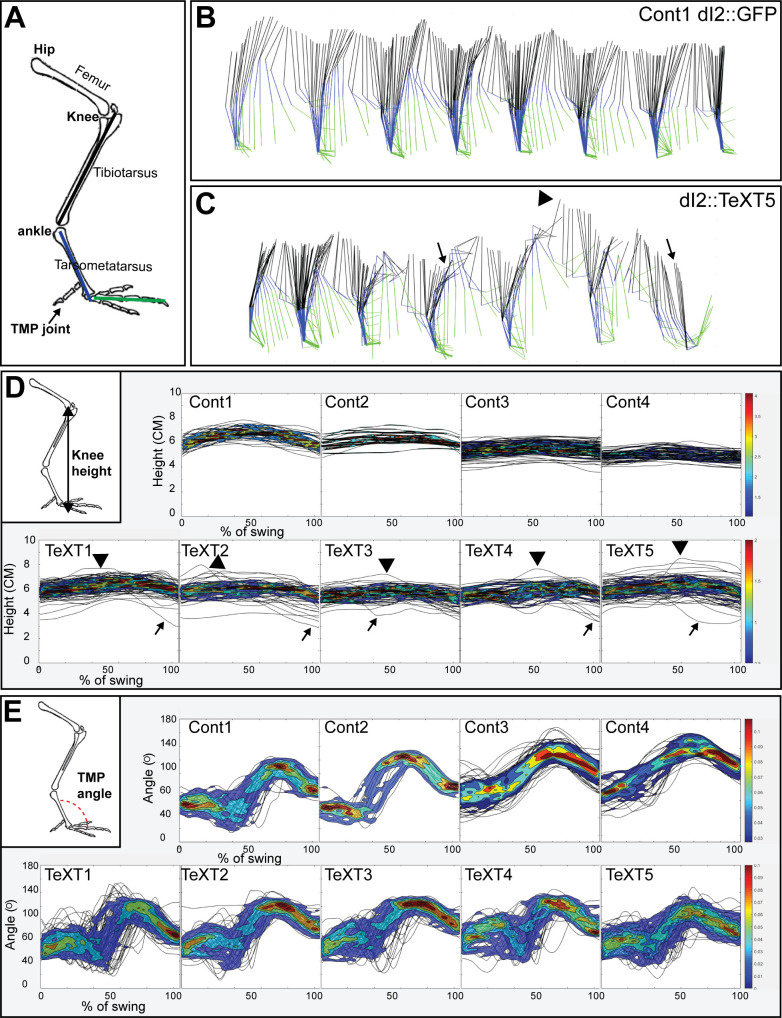
Figure 6. Kinematic analysis of locomotion in posthatching chicks following the silencing of dI2 neurons.
(A) Schematic illustration of chick hindlimb joints (bold) and bones (regular). The knee joint connects the femur and the tibiotarsus, and the ankle connects the tibiotarsus and the tarsometatarsus, which connects to the phalanges at the TMP joint. During the swing phase of birds, ankle flexion leads to foot elevation, while the knee is relatively stable. (B, C) Stick diagrams of stepping in a control chicken d2::GFP (B) and in a d2::TeTX chicken (C). Arrows indicate collapses, and overshoots are denoted by arrowheads. (D) Overlays of knee height (demonstrated in insert) trajectories during the swing phase in all analyzed steps of each of the control and TeTX-treated posthatching day (P) 8 hatchlings are shown superimposed with the respective 20–80% color-coded density plots as a function of the percentage of swing (see text and Materials and methods). Arrows indicate collapses, and overshoots are indicated by arrowheads. (E) The angular trajectories of the TMP joint (shown in insert) during the swing phase in all analyzed strides of each of the control and TeTX-treated P8 hatchlings are shown superimposed on the respective 20–80% color coded density plots as a function of the percentage of swing (see text and Materials and methods). See Figure 6—source data 1, Figure 6—source data 2, Figure 6—source data 3.


