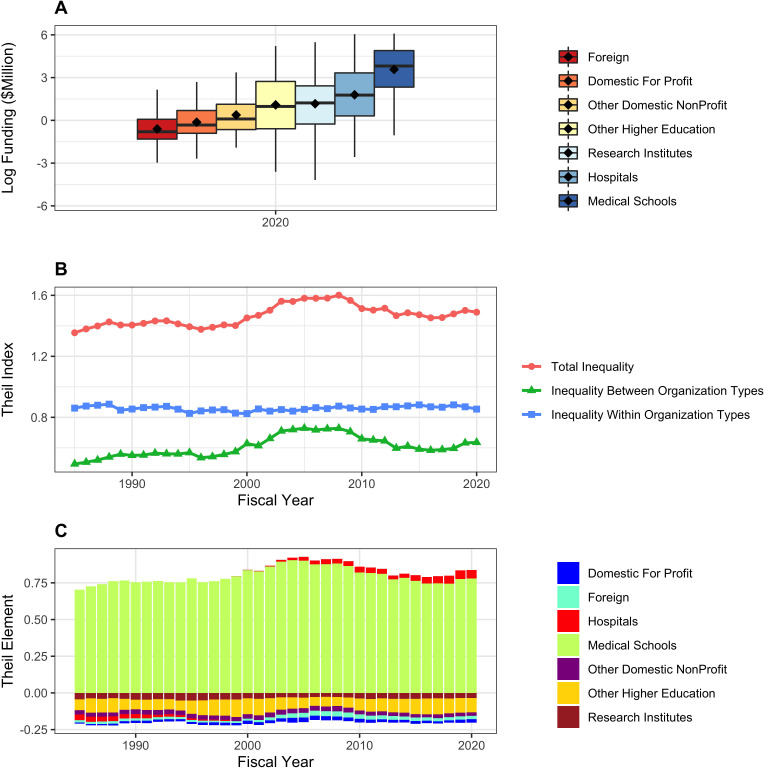
Figure 7. RPG funding distribution and inequalities according to organization type.
Panel A: Box plots showing distributions of log-transformed RPG funding in FY2020. Panel B: Theil index components plot, showing that both between group and within group inequalities contribute to overall inequality. Panel C: Theil elements plot. Values above the zero line indicate that groups received above average fundings, while values below zero indicate below average funding. Medical schools and hospitals received above average funding.

