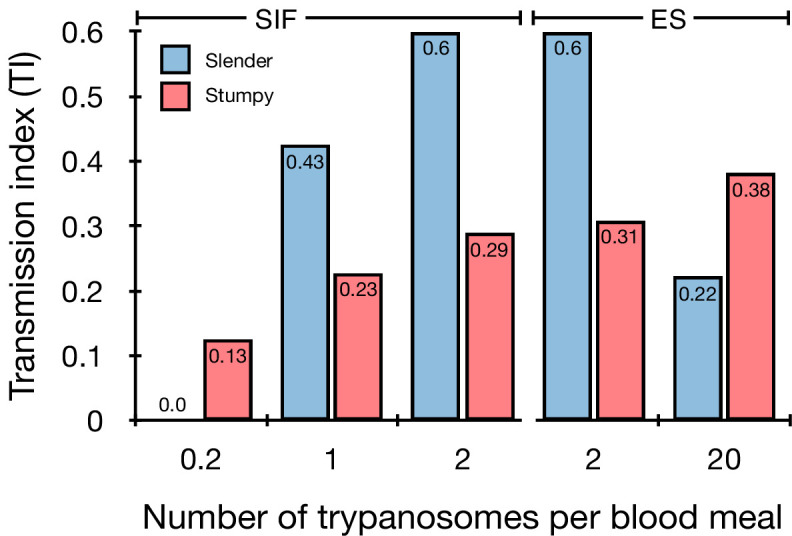
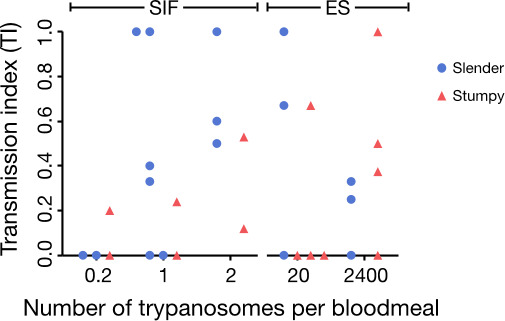
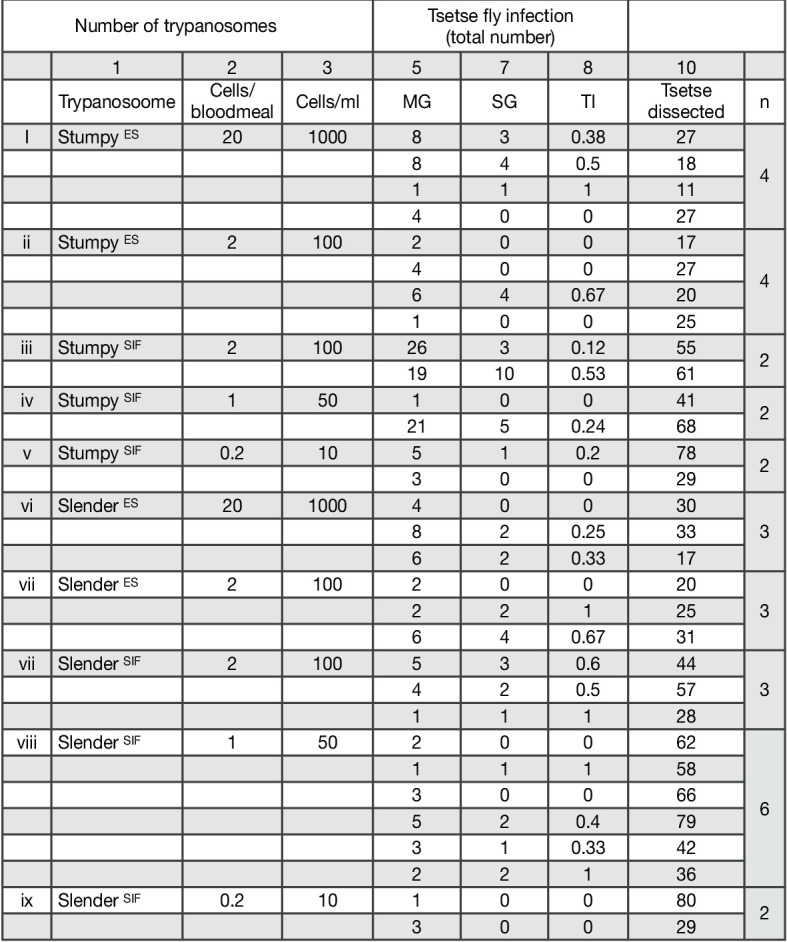
Figure 3. Graphical representation of the transmission index TI (number of salivary gland infections divided by the number of midgut infections) of slender (blue) and stumpy (red) trypanosomes at different numbers of trypanosomes per bloodmeal (data reproduced from Figure 2A, column 8).
A high TI indicates successful completion of the life cycle in the tsetse vector. At low infective doses, slender trypanosomes had a higher TI compared to stumpy parasites. There was no difference between stumpy parasites generated by SIF-treatment (SIF) or expression site attenuation (ES).

Figure 3—figure supplement 1. Graphical representation of the transmission index (TI - number of salivary gland infections divided by midgut infections) of slender (blue) and stumpy (red) trypanosomes for the individual experiments (n) at different numbers of trypanosomes per bloodmeal (individual replicates from data in Figure 2A, column 8).

Figure 3—figure supplement 2. Transmission index TI (number of salivary gland infections divided by midgut infections) of slender and stumpy trypanosomes for the individual experiments (n) at different numbers of trypanosomes per bloodmeal (individual replicates from data in Figure 2A, column 8).

