. 2021 Aug 6;10:e66028. doi: 10.7554/eLife.66028

Figure 4. Exemplary images of procyclic trypanosomes in the explanted tsetse midgut 24 hr post infection with slender cells.

Morphology (DIC panels, left), cell cycle status (DAPI label, middle panels) and expression of fluorescent reporters (right) were scored. Note that the upper panels show a cell with procyclic morphology that is nonetheless EP1:YFP negative, indicating that the EP1 signal underestimates the total numbers of procyclic cells in the population. Scale bar: 5 µm.
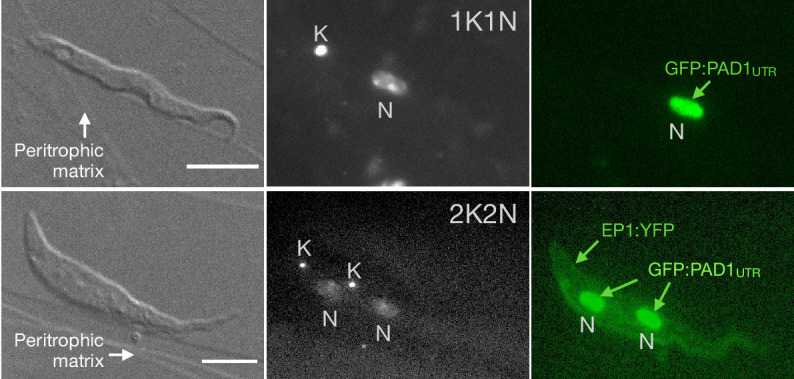
Figure 4.

Figure 4—video 1. After uptake by the tsetse fly, slender trypanosomes promptly activate the PAD1 pathway, while the continuously dividing.
Download video file (1.6MB, mp4)
Videos channels are shown in the order: DIC, GFP, DAPI. All videos were recorded at 250 fps, and the cell cycle position is indicated by DAPI staining. (A) Dividing (2K2N) long slender trypanosome in the tsetse fly, 2 hr post infection (h.p.i). No GFP:PAD1UTR signal is detectable. (B) Cell cycle arrested (1K1N) short stumpy trypanosome in the tsetse fly, 2 h p.i. The GFP:PAD1UTR reporter is expressed. (C) Dividing (2K1N) long slender trypanosome in the tsetse fly, 15 h.p.i. The GFP:PAD1UTR signal is clearly visible. (D) Dividing (2K2N) procyclic trypanosome in the tsetse fly, 48 h p.i. The cell expresses both GFP:PAD1UTR and EP1:YFP.