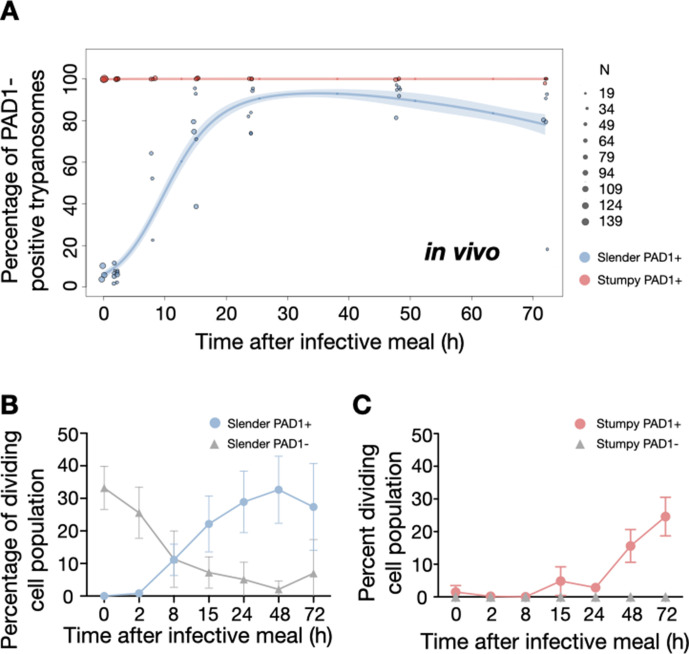
Figure 5. Slender trypanosomes activate the PAD1 pathway upon uptake by the tsetse fly.
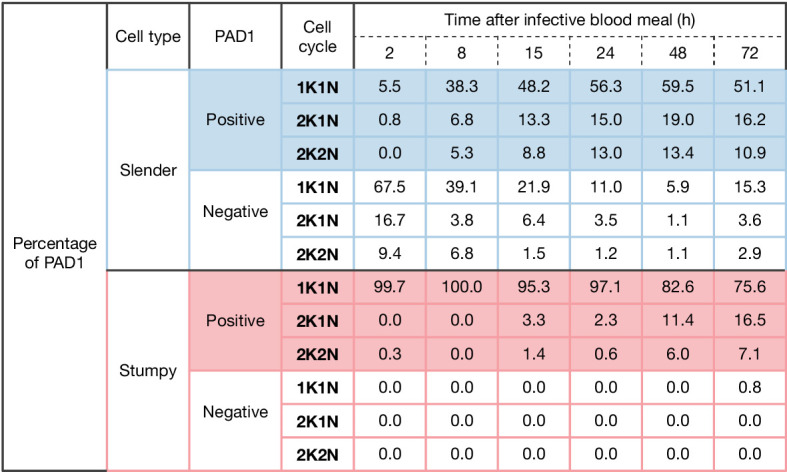
Tsetse flies were infected with either slender (3.6% PAD1-positive) or stumpy (100% PAD1-positive) trypanosomes. 72 (slender) or 42 (stumpy) flies were dissected (equal sex ratios) at different timepoints after infection (for each time point, one hour was given to either slender or stumpy infected flies for dissection and cell analysis). Experiments were done at least three times. Living trypanosomes (>100 cells per time point) were microscopically analysed in the explanted tsetse midguts and scored for the expression of the fluorescent stumpy reporter GFP:PAD1UTR in the nucleus. Stumpy cells (n=1237) are red, and slender cells (n=1845) are blue. (A) Percentages of PAD1-positive slender and stumpy cells over time after uptake by the tsetse fly. Points indicate the individual experiments for either slender (blue) or stumpy (red). Point sizes correspond to the total number of cells counted per experiment. These data were fed into a point estimate model and are shown as solid lines, indicating the predicted percentage of PAD1-positive cells, based on time vs. cell type. Transparent colours indicate the associated 95% confidence bands. The difference between slender and stumpy cells over time is strongly significant (p<0.001). (B, C) Slender and stumpy trypanosomes scored as PAD1-positive or -negative were also stained with DAPI, and the cell cycle position determined based on the configuration of kinetoplast (K) to nucleus (N) at the timepoints indicated. The dividing slender population (B) and dividing stumpy population (C) are shown. As seen, the percentage of PAD1-positive slender cells steadily increased (B, blue) while the percentage of PAD1-negative cells steadily decreased (B, grey). This shows that slender cells can seamlessly turn on the PAD1 pathway, within a continuously dividing population. Stumpy cells did not show a normal cell cycle profile until 48 hr after tsetse uptake (C, red), as the cells differentiated to the procyclic stage. They did however remain PAD1-positive even as dividing parasites at 72 hr. Data are shown as mean +/- SD. Points without SD were the result of two measurements at those timepoints.
Figure 5—figure supplement 1. Slender populations exhibit continuous division while turning on the PAD1 pathway.

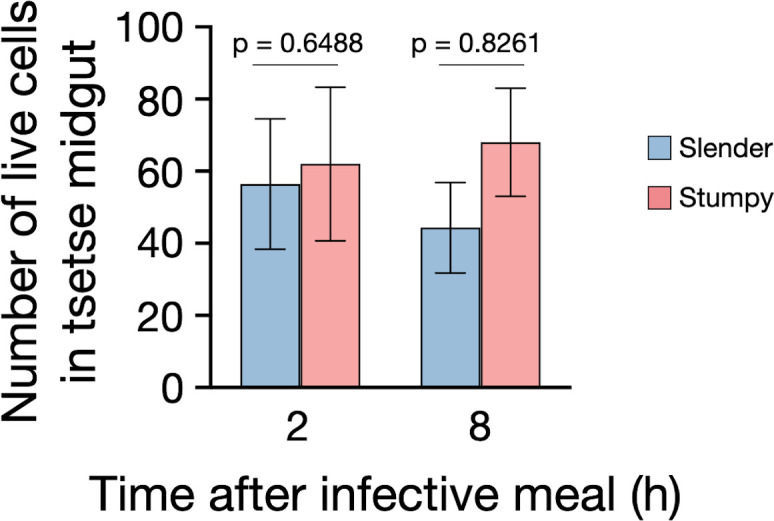
Figure 5—figure supplement 2. Slender cells survive in the tsetse midgut at early timepoints after infection.


