. 2021 Aug 6;10:e66028. doi: 10.7554/eLife.66028

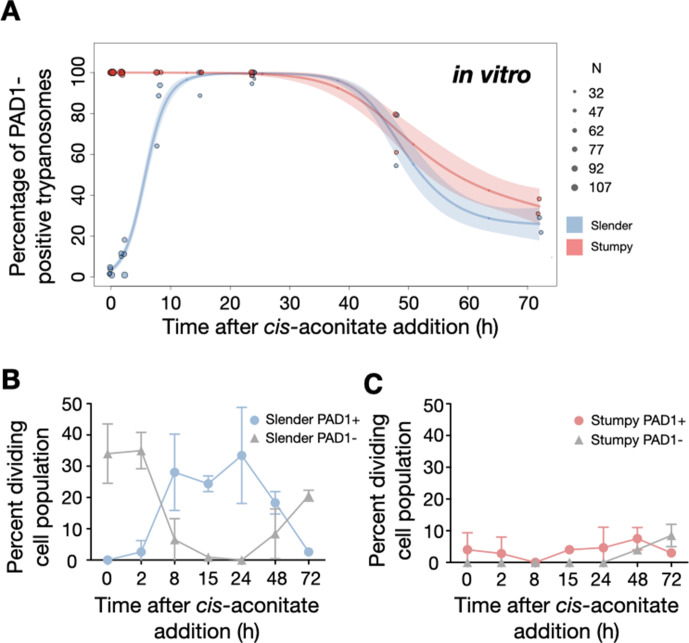
Figure 7. Slender trypanosomes activate the PAD1 pathway in vitro with a continuously dividing population.

Cultured slender or stumpy trypanosomes were differentiated in vitro by the addition of cis-aconitate and a temperature reduction to 27°C. At the times indicated, trypanosomes were analysed for the expression of the fluorescent stumpy reporter GFP:PAD1UTR, as in Figure 5. Slender cells (n=1653) are shown in blue and stumpy cells (n=1798) in red. Data were compiled from five independent experiments, with each time point being analysed in at least two separate experiments. (A) Percentages of PAD1-positive slender and stumpy cells over time. Points indicate the individual experiments for either slender (blue) or stumpy (red) trypanosomes. Point sizes correspond to the total number of cells counted per experiment. These data were fed into a point estimate model, and are shown as solid lines, indicating the predicted percentage of PAD1-positive cells, based on time vs. cell type. Transparent colours indicate the associated 95% confidence bands. The difference between slender and stumpy cells over time was strongly significant (p<0.001). (B, C) Slender and stumpy trypanosomes scored as PAD1-positive or -negative were also stained with DAPI, and the cell cycle position determined based on the configuration of kinetoplast (K) to nucleus (N) at the timepoints indicated. The dividing slender population (B) and dividing stumpy population (C) are shown. As seen, the percentage of PAD1-positive slender cells steadily increased (B, blue) and the percentage of PAD1-negative cells steadily decreased (B, grey). This shows that slender cells can turn on the PAD1 pathway without apparent cell cycle arrest. Although a small portion of the stumpy population was observed to to divide throughout the time points (C, red), cells did not return to a normal cell cycle profile until 48 hr after the addition of cis-aconitate. As the cells became more procyclic, they began to lose their PAD1 signal and an increase in PAD1-negative dividing cells was seen (B, C, grey). Data are shown as mean +/- SD. Points without SD were the result of two measurements at those timepoints.

Figure 7.

Figure 7—figure supplement 1. Slender trypanosomes activate the PAD1 pathway in vitro with a continuously dividing cell population.
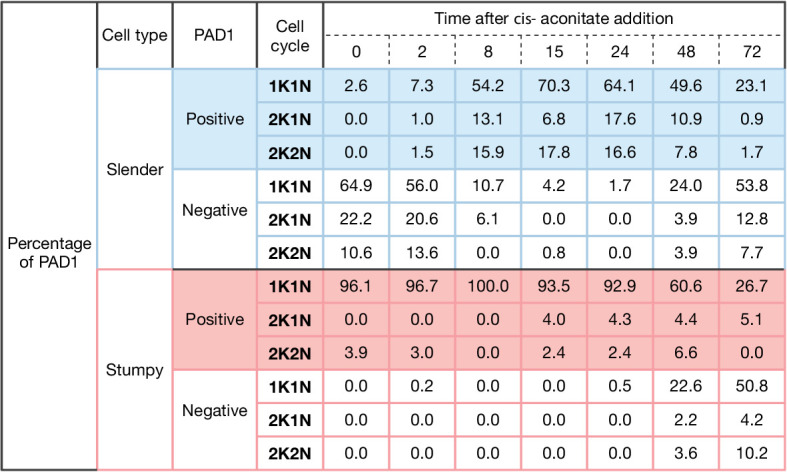
Figure 7—figure supplement 1.

Cultured slender or stumpy trypanosomes were differentiated in vitro by the addition of cis-aconitate and temperature reduction to 27°C. At the times indicated, trypanosomes were analysed for the expression of the fluorescent stumpy reporter GFP:PAD1UTR. Data were compiled from five independent experiments, with each time point being analysed in at least two separate experiments. Slender (n=1653) and stumpy (n=1798) trypanosomes scored as PAD1-positive or -negative were also stained with DAPI, and the cell cycle position determined based on the configuration of kinetoplast (K) to nucleus (N) at the timepoints. The percentages of either PAD1-positive (color-filled boxes) or -negative (white-filled boxes) cells for both slender (blue) and stumpy (red) are shown for each stage of the cell cycle over the seven time points. These data show that slender cells can seamlessly turn on the PAD1 pathway within a continuously dividing population. Stumpy cells did not show a normal cell cycle profile until 48 hr after tsetse uptake, as the cells differentiated to the procyclic stage.
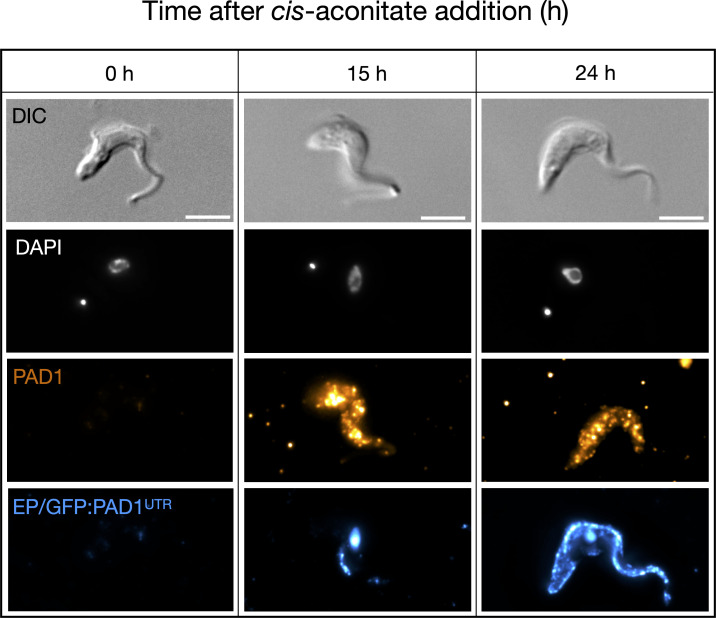
Figure 7—figure supplement 2. Slender cells express PAD1 and EP on their surface after the addition of cis-aconitate.

Figure 7—figure supplement 2.

Immunofluorescence timecourse (h = hours) of slender cells from the cell line GFP:PAD1UTR after the addition of cis-aconitate. Cells were fixed in formaldehyde and labelled with both anti-PAD1 and anti-EP antibodies, without membrane permeabilisation, in order to only detect surface-localised proteins. The fluorescent nucleus seen in the ‘EP’ channel at 15 and 24 hr timepoints are from the background GFP:PAD1UTR signal (containing a nuclear localisation sequence and having the same fluorescent signal as the secondary antibody used to target anti-EP), further showing that the PAD1 mRNA signal correlates with the expression of the PAD1 protein on the cell surface. DAPI (grey), PAD1 (orange), and EP (blue) are shown. Scale bar = 5 µm.
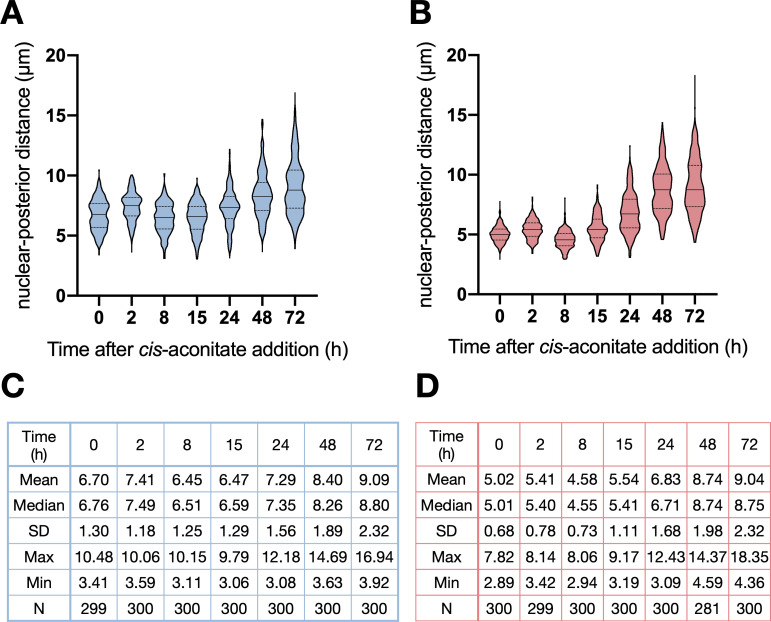
Figure 7—figure supplement 3. Slender trypanosomes exhibit procyclic morphology on the same time scale as stumpy trypanosomes when differentiating.

Figure 7—figure supplement 3.

Cultured slender (harvested at or below 5x10⁵ cells/ml) or stumpy (Seeded at 5x10⁵ cells/ml and left undiluted for 48 hr before harvesting) trypanosomes were differentiated in vitro by the addition of cis-aconitate and a temperature reduction to 27°C. The distance from the centre of the cell nucleus to the posterior end of the cell, following the midline, was measured (in µm) by overlaying DIC and DAPI images, and using imageJ. Three independent experiments were conducted three times per timepoint, with 81–100 cells being analysed for each. (A–B) Violin graphs showing all data collected for slender (A) and stumpy (B) trypanosomes over several timepoints after the addition of cis-aconitate. The solid line is at the median, with dotted lines at the 25% and 75% quartiles. (C–D) Tables showing the mean, median, standard deviation (SD), maximum distance measured (Max), Minimum distance measured (Min), and the total cell number analysed (n) for each time point.