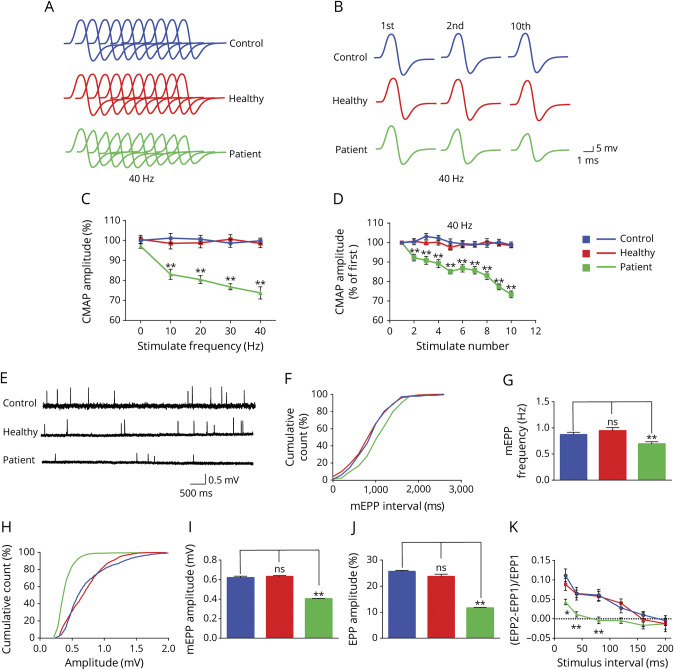
Figure 3. Decreased Compound Muscle Action Potentials (CMAPs) and Presynaptic and Postsynaptic Deficits in Patient Immunoglobulin (Ig)–Injected Mice.
(A) Stacked 10 succession CMAP traces at 40 Hz. (B) CMAP traces in response to the first, second, and 10th stimuli. (C) Reduced CMAP amplitudes of the 10th stimulation at different stimulation frequencies in patient Ig-injected mice, not in healthy Ig-injected mice, compared with phosphate-buffered saline (PBS)–injected control mice. (D) Reduced CMAP amplitudes at 40 Hz. (E) Representative miniature end plate potential (mEPP) traces. (F, H) Cumulative plots of mEPP events against interval (F) or amplitude (H). (G, I) Reduced mEPP frequency (G) and amplitude (I) in patient Ig-injected mice, not in healthy Ig-injected mice, compared with PBS-injected control mice. (J) Reduced end plate potential (EPP) amplitude in patient Ig-injected mice, not in healthy Ig-injected mice, compared with PBS-injected control mice. (K) Decreased PPR in patient Ig-injected mice, not in healthy Ig-injected mice, compared with PBS-injected control mice. n = 3 mice per group. *p < 0.05, **p < 0.01.

