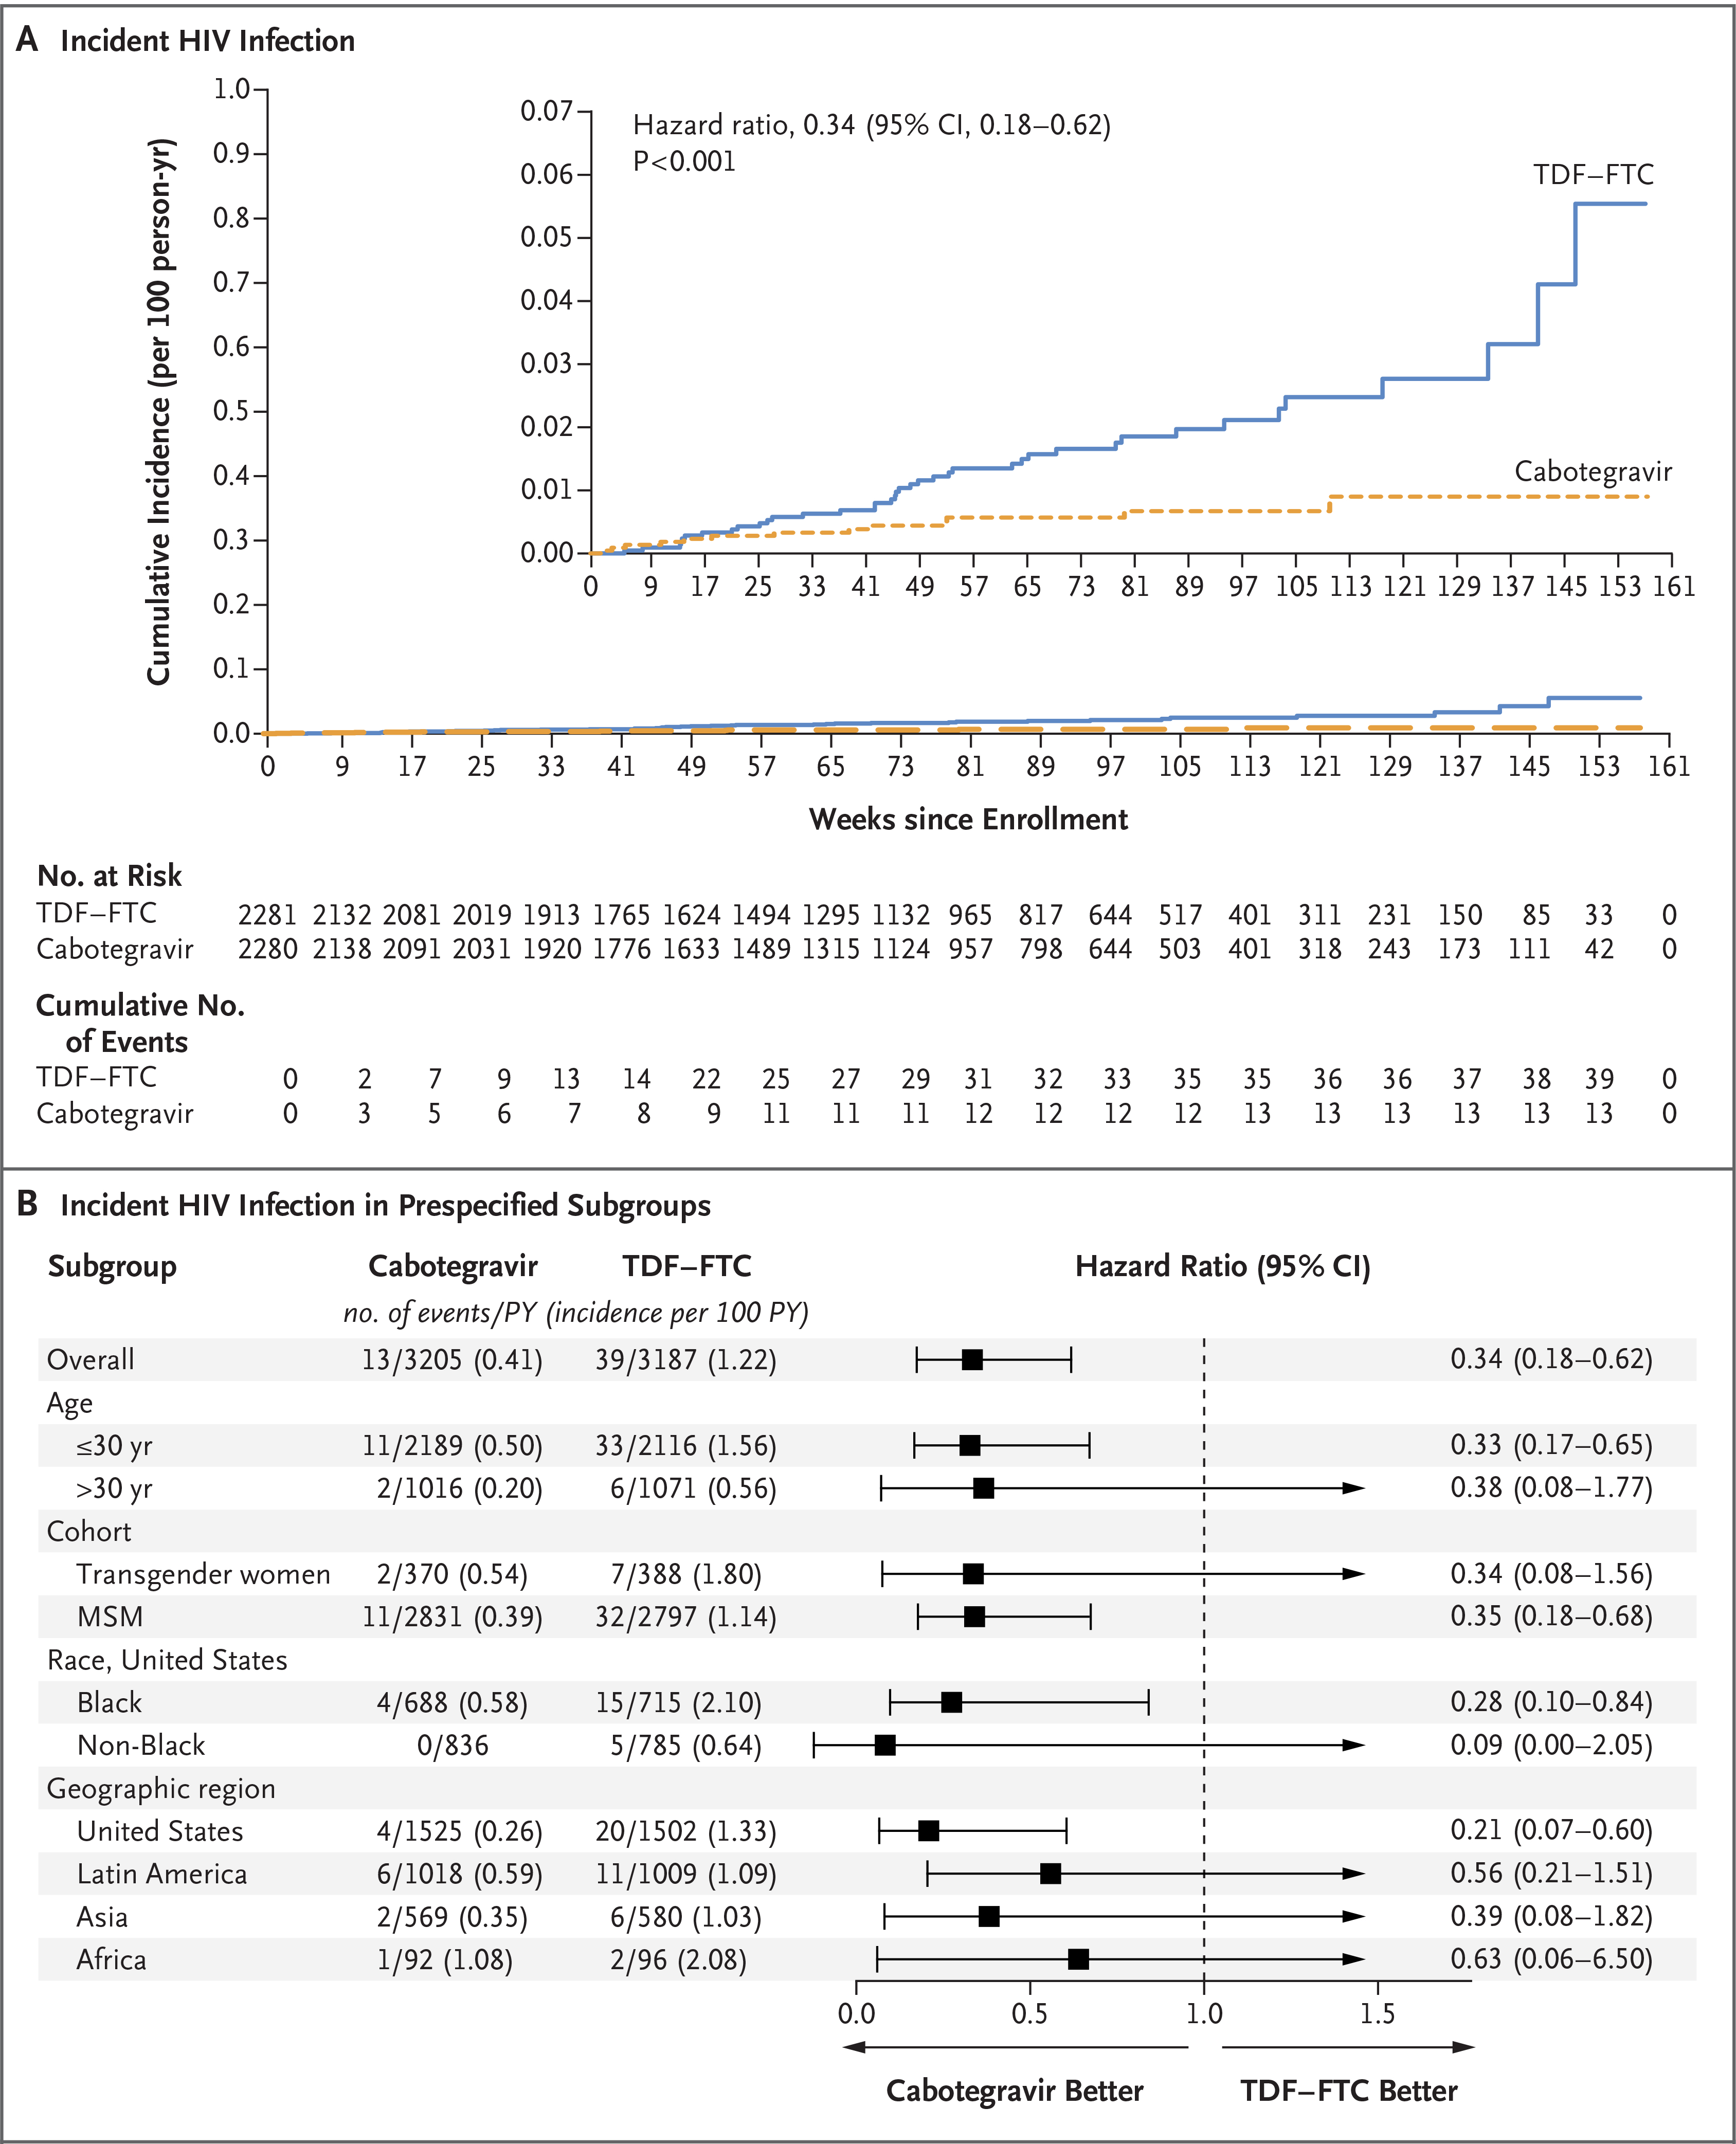
Figure 2. Incident HIV infection.

Panel A shows Kaplan–Meier estimates of incident HIV infection. The inset shows the same data on an enlarged y axis. Panel B shows hazard ratios for incident HIV infection in the prespecified subgroups. Race was reported by the participant. MSM denotes men who have sex with men, and PY person-years.
