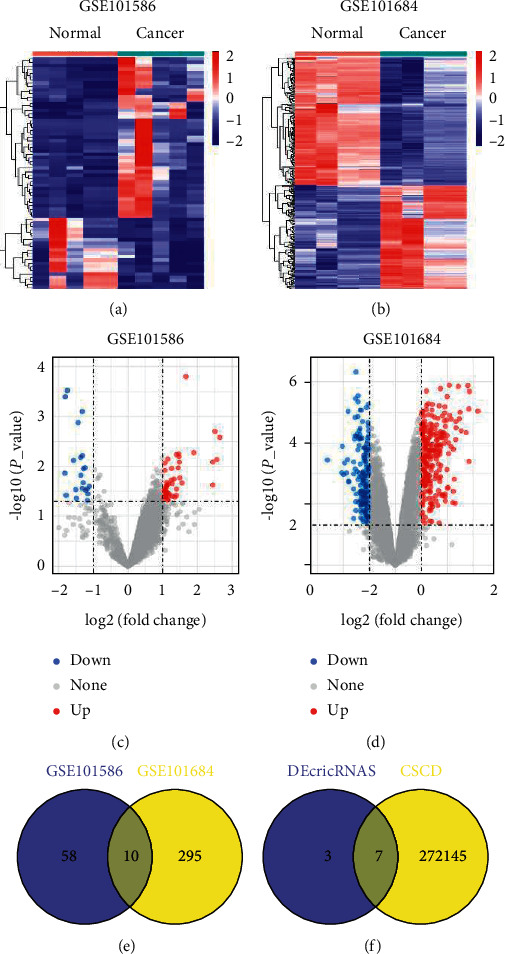
Figure 2.

Identification of differentially expressed circRNAs in LUAD. (a, b) Hierarchical clustering heat map of the DEcircRNAs of LUAD samples compared with normal lung samples from GSE101586 and GSE101684, with absolute fold-changes >1 and P value < 0.05 as significant. (c, d) The volcano maps showed the number and distribution of the DEcircRNAs. The red dots represent the upregulated circRNAs and the blue dots indicate the downregulated circRNAs. (e) Venn diagram of the intersection of DEcircRNAs in GSE101586 and GSE101684 datasets. (f) Venn diagram of the intersection of differentially expressed and cancer-specific circRNAs based on Cancer-Specific CircRNA Database (CSCD, http://gb.whu.edu.cn/CSCD).
