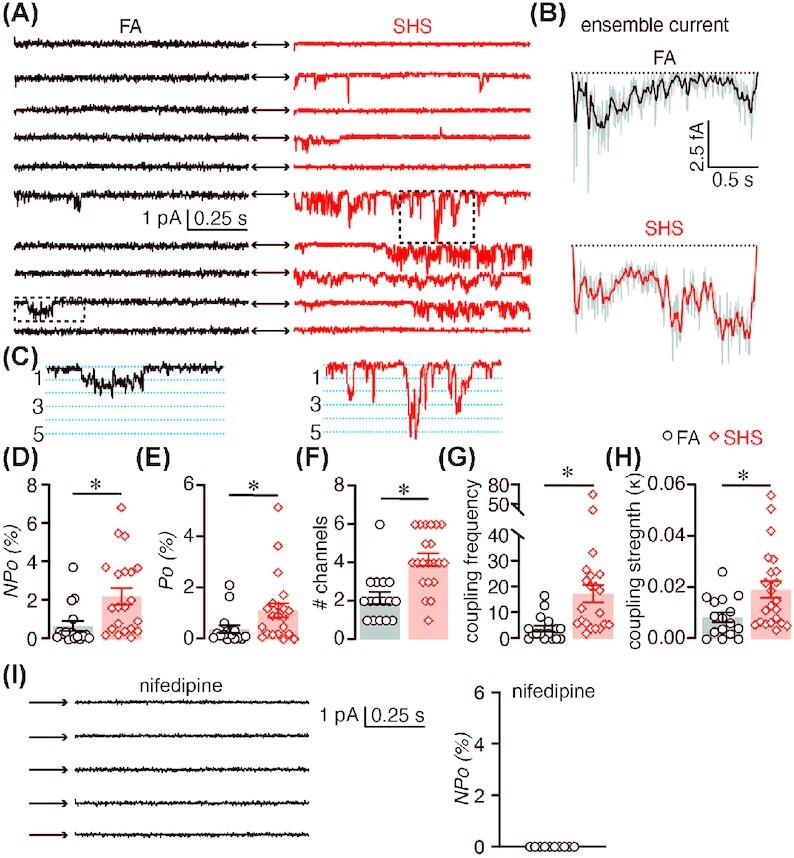
Figure 2.

LTCC activity in FA and chronic SHS-exposed arterial myocytes. (A) Representative consecutive LTCC single-channel traces recorded from FA and 12 wk SHS-exposed arterial myocytes and (B) corresponding ensemble average currents. (C) Magnified region from the dotted squares in panel A showing coupled channel events. (D–H) Scatter plot of the mean ± SEM for nPo (D), Po (E), # channels (F), coupled frequency (G), and coupled strength (H) of LTCC single-channel data from FA (n = 16 cells) and 12 wk SHS-exposed (n = 21 cells) arterial myocytes. *P < .05 compared to FA, Mann–Whitney. (I) Representative consecutive LTCC single-channel traces in presence of the LTCC channel blocker nifedipine (1 μM).
