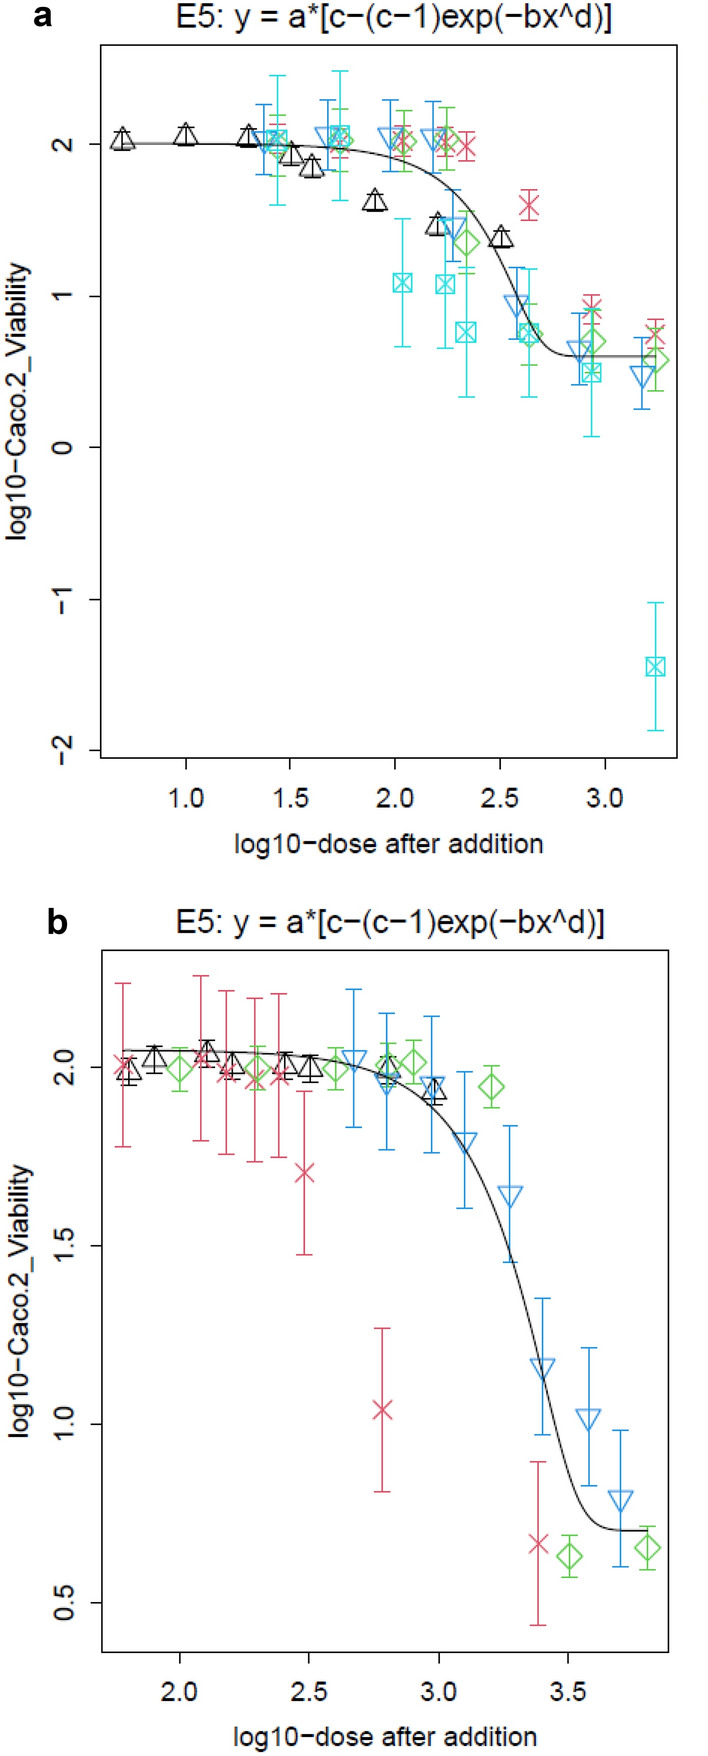
Fig. 3.

Concentration–response modelling of the cytotoxicity in Caco-2 cells of a abamectin (black upward triangle), Soprophor® BSU (dark blue downward triangle), Soprophor® 3D33 (green diamond), product 1 (red cross), combination of abamectin and respective co-formulants (light blue cross-square) and b fluroxypyr-meptyl (black upward triangle), Rhodacal® 60/BE (green diamond), Solgad® 150 ULN (dark blue downward triangle) and product 2 (red cross). The black lines are representing the dose–response curves of the mixtures under the assumption of dose addition of the single substances. Modelling was performed using the PROAST software ver. 70 (color figure online)
