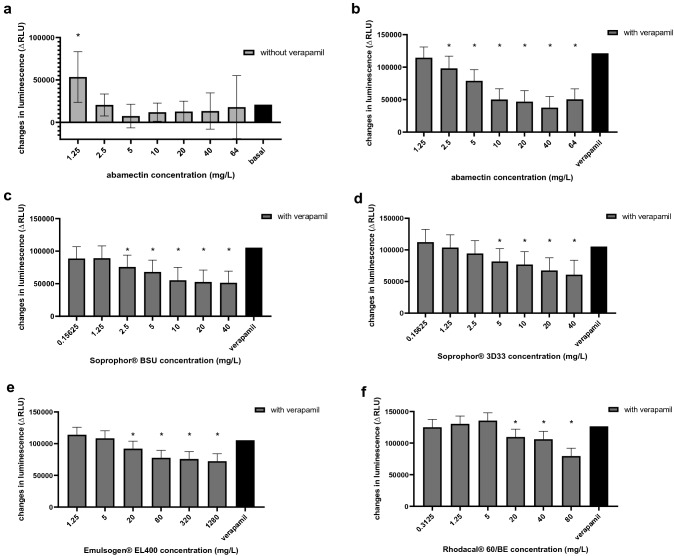
Fig. 5.
Pgp ATPase activity presented as changes in luminescence ΔRLU of (a) abamectin compared to untreated samples (basal) and (b–f) abamectin, Soprophor® BSU, Soprophor® 3D33, Emulsogen® EL 400 and Rhodacal® 60/BE after stimulation with verapamil compared to verapamil control. All measurements were corrected by subtraction of Na3VO4-treated signals (non Pgp ATPase activity). Data are presented as mean values of n = 4 independent experiments. Error bars indicate confidence intervals obtained from statistical analysis using an either two-sided (error bars in both direction) or one-sided (error bars in one direction) post hoc Dunnett test (α = 0.05), with a preceding linear mixed-effects ANOVA test (α = 0.05). Statistical significance compared to untreated control/verapamil control is defined by asterisks (*)

