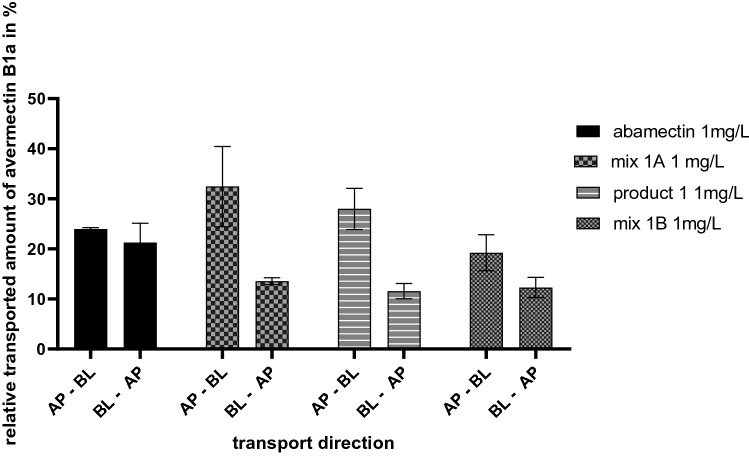
Fig. 7.
Comparison of the cumulative transported amount of avermectin B1a in % after 8 h of incubation in AP–BL and BL–AP direction carried out with 1 mg/L abamectin, mix 1A (1 mg/L abamectin + 4.2 mg/L Tween® 80, 1 mg/L Soprophor® BSU, 1 mg/L Soprophor® 3D33), product 1 (containing 1 mg/L abamectin) and mix 1B (1 mg/L abamectin + 80 mg/L Tween® 80, 40 mg/L Soprophor® BSU, 40 mg/L Soprophor® 3D33). Data are presented as mean values ± SD of n = 3 independent experiments

