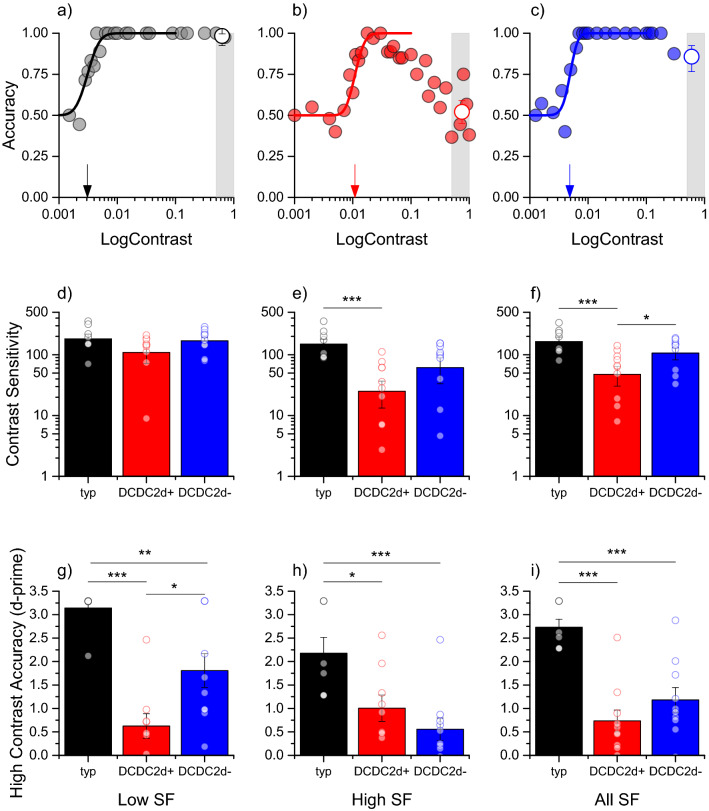
Fig. 1.
Deficits in motion perception for DCDC2d+ and DCDC2d– dyslexics. a–c Accuracy for motion direction discrimination as a function of stimulus contrast for a typical observer (a), a DCDC2d+ dyslexic (b) and a DCDC2d– dyslexic (c) for gratings 1 c/deg drifting at 8 Hz. Small arrows indicate the discrimination threshold (i.e. 75% correct responses), the shaded area shows the contrast range (above 50%) used to calculated the high contrast accuracy index (hollow symbol). d, e Contrast sensitivity for motion in the three groups averaging the low spatial frequencies (0.5 and 1 c/deg (d)), the high spatial frequencies (2 and 4 c/deg, (e)) or all of the spatial frequencies (f). g–i High-contrast accuracy for the three groups at low (g), high (h) and all spatial frequencies (i). Symbols indicate individual subjects, error bars are S.E.M. Statistically significant differences are flagged (*p < 0.05, **p < 0.01, ***p < 0001)

