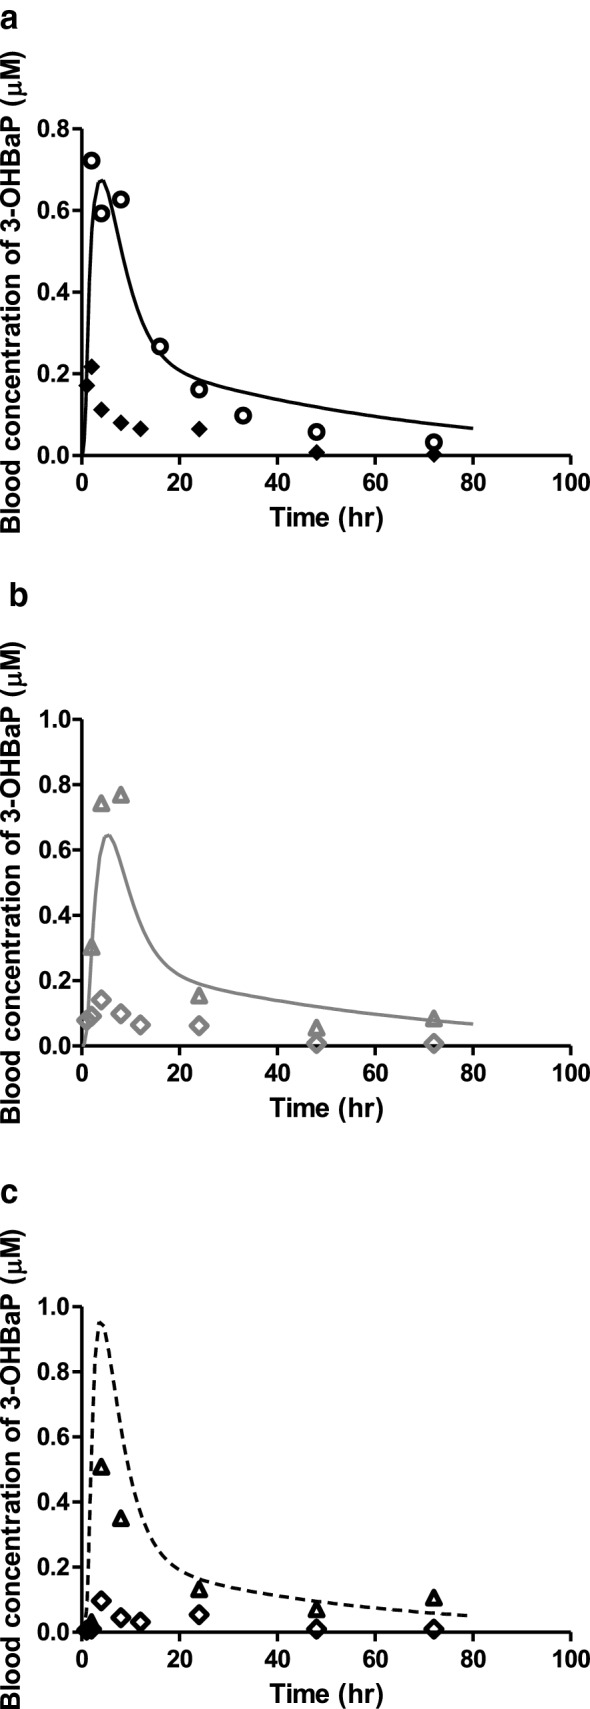
Fig. 6.

Reported and predicted blood concentrations of 3-OHBaP in rats upon (a) intravenous, (b) intratracheal and (c) oral exposure to 10 mg/kg BaP in rats. Symbols represent (a) the average blood concentrations reported in the in vivo studies of Moreau and Bouchard (2015) for intravenous (filled diamonds) and Marie et al. (2010) (open circles) for intravenous exposure. Symbols represent (b) the average blood concentrations reported in the in vivo studies of Moreau and Bouchard (2015) (grey open diamonds) and scaled Moreau and Bouchard data based on the fold difference observed in intravenous data (grey open triangles) upon intratracheal exposure. Symbols represent (c) the average blood concentrations reported in in vivo studies of Moreau and Bouchard (2015) (black open diamonds) and scaled Moreau and Bouchard data based on the fold difference observed in intravenous data (black open triangles) upon oral exposure. The lines represent the model predicted blood concentrations upon (a) intravenous (black solid line), (b) intratracheal (grey solid line) and (c) oral (black dashed line) exposure
