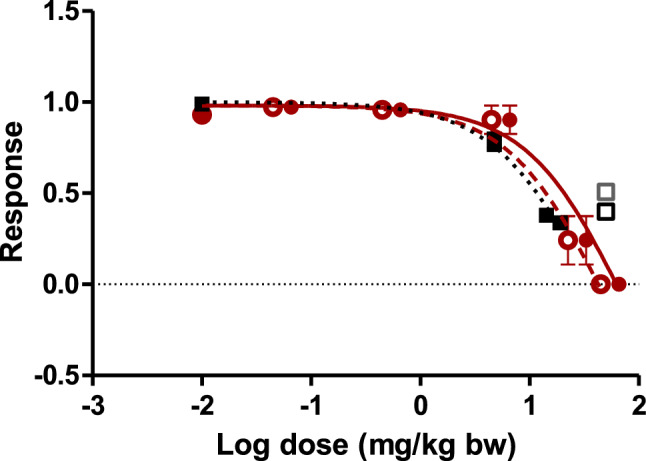
Fig. 8.

Model predicted and reported in vivo dose–response curves for developmental toxicity of BaP in rats upon single and repeated oral exposure. The predicted dose–response curves are translated from the concentration response curve obtained in the EST for 3-OHBaP (Kamelia et al. 2020) representing single oral exposure (filled red circles and red solid line) and repeated oral exposure (red open circles and red dashed line). Filled black squares and dotted black line represent the in vivo data of Archibong et al. (2002), the open squares represent the data of Bui et al. (1986) for 3 day exposure (black open square) and 6 day exposure (grey open square). The error bars represent the standard error of the mean (SEM) (color figure online)
