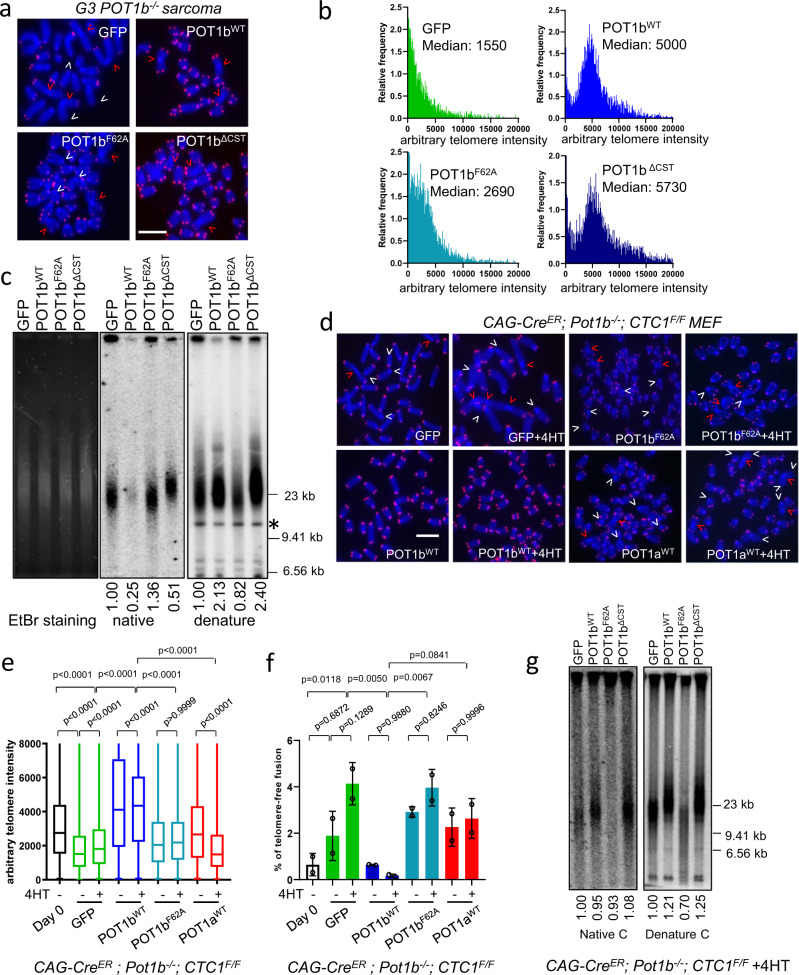
Fig. 2. POT1b-mediated telomere elongation is independent of CST function.
a PNA-FISH of G3 Pot1b−/− sarcomas reconstituted with the indicated DNA constructs. Red arrows point to telomere-free chromosome fusions; white arrows point to telomere-free chromosome ends. Scale bar: 5 µm. b Distribution of telomere lengths by Q-FISH in (a). A minimum of 30 metaphases were analyzed in three independent experiments. Numbers indicate median telomere lengths. c Detection of G-overhangs (native gel) and total telomere lengths (denature gel) by TRF Southern. *: DNA band used for quantification. EtBr: Ethidium Bromide. Numbers indicate relative G-overhang and total telomere signals, with telomere signals set to 1.0 for cells expressing GFP. d PNA-FISH of CAG-CreER; Pot1b−/−; CTC1F/F MEFs ± 4-HT reconstituted with indicated POT1a or POT1b. Red arrows point to telomere-free chromosome fusions and white arrows point to telomere-free chromosome ends. Scale bar: 5 µm. e Quantification of telomere lengths in (d) by Q-FISH. At least 30 metaphases were analyzed per genotype. Box show the median and interquartile range (25% to 75%) from three independent experiments. p-values are shown and generated from one-way ANOVA analysis followed by Tukey’s multiple comparison. f Quantification of telomere-free chromosome fusions in (d). At least 30 metaphases were analyzed per genotype. Data show the mean ± s.d. from two independent experiments. p-values are shown and generated from one-way ANOVA analysis followed by Tukey’s multiple comparison. g TRF Southern to detect the G-overhang (native gel) and total telomere lengths (denature gel) of CAG-CreER; Pot1b−/−; CTC1F/F MEFs + 4-HT, expressing the indicated DNAs. Molecular weight markers are indicated. Numbers indicate relative G-overhang and total telomere signals, with telomere signals set to 1.0 for cells expressing GFP.

