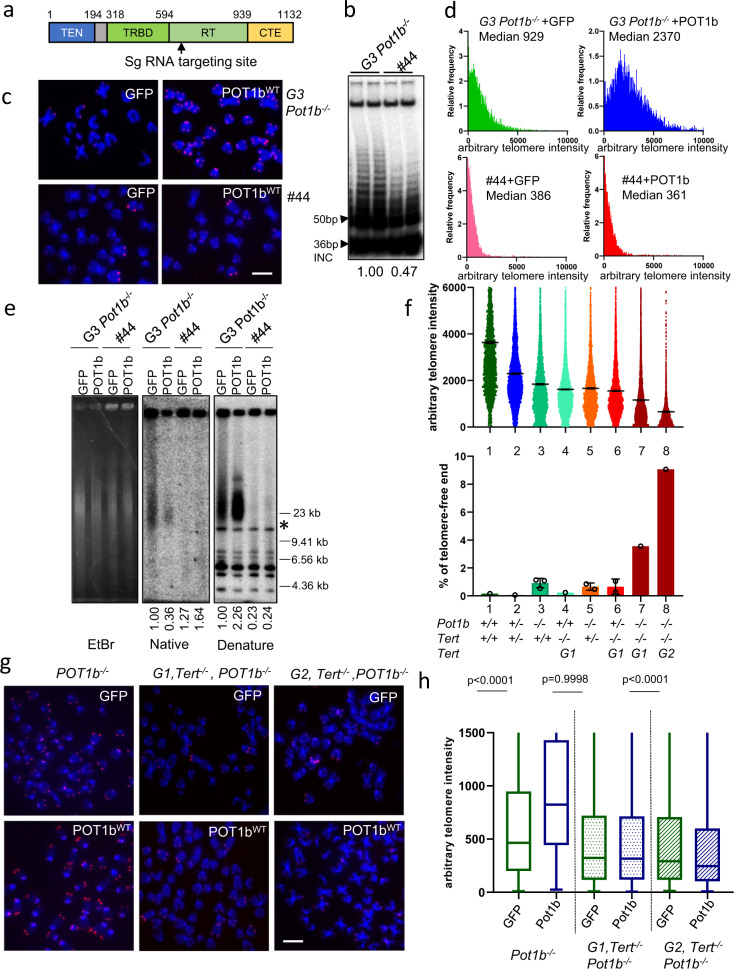
Fig. 3. Accelerated telomere shortening in Pot1b−/−; Tert−/− cells.
a Arrow points to the targeting site of CRISPR/Cas9 guide RNA of mouse mTert cDNA. TEN: Telomerase Essential N-terminal domain. TRBD: Telomerase RNA Binding Domain. RT: Reverse Transcriptase domain. CTE: C-Terminal Extension domain. b Detection of telomerase activity in G3 Pot1b−/− parental cells and Pot1b−/−; Terthypo clone #44 by the TRAP assay. 2000 cells were used in each reaction. Numbers indicate TRAP activity, with 1.0 set for G3 Pot1b−/− samples. INC: internal control. c PNA-FISH of G3 Pot1b−/− sarcoma and Pot1b−/−; Terthypo clone #44 reconstituted with GFP or POT1bWT. Scale bar: 5 µm. d Distribution of telomere length in (c) quantified by Q-FISH. At least 40 metaphases were analyzed per genotype in three independent experiments. Median telomere length are indicated. e Detection of G-overhang (native gel) and total telomere lengths (denature gel) in cells of the indicated genotypes by TRF Southern. *: DNA band used for quantification. EtBr: Ethidium Bromide staining shows equal loading of genomic DNA. Molecular weight markers are indicated. *: DNA band used for quantification. Numbers indicate relative G-overhang and total telomere signals, with telomere signals set to 1.0 for cells expressing GFP. f Telomere lengths in primary MEFs of the indicated genotypes measured by Q-FISH and percentage of telomere-free ends. A minimum of 40 metaphases were analyzed per genotype. At least 1500 chromosomes were scored for telomere signals and data show the mean ± s.d. from different cell lines with same genotyping. Pot1b−/−; Tert+/+ 3 cell lines; Pot1b−/−; Tert+/− 2 cell lines and Pot1b+/−; Tert−/− 2 cell lines. g PNA-FISH images of SV40-immortalized Pot1b−/− or Pot1b−/−, Tert−/− MEFs expressing GFP or POT1bWT. Scale bar: 5 µm. h Quantification of relative telomere lengths in (g). A minimum of 40 metaphases were analyzed per genotype. Box plots show the interquartile range (25% to 75%) and median from two independent experiments. p-values are shown and generated from unpaired Student’s t test.

