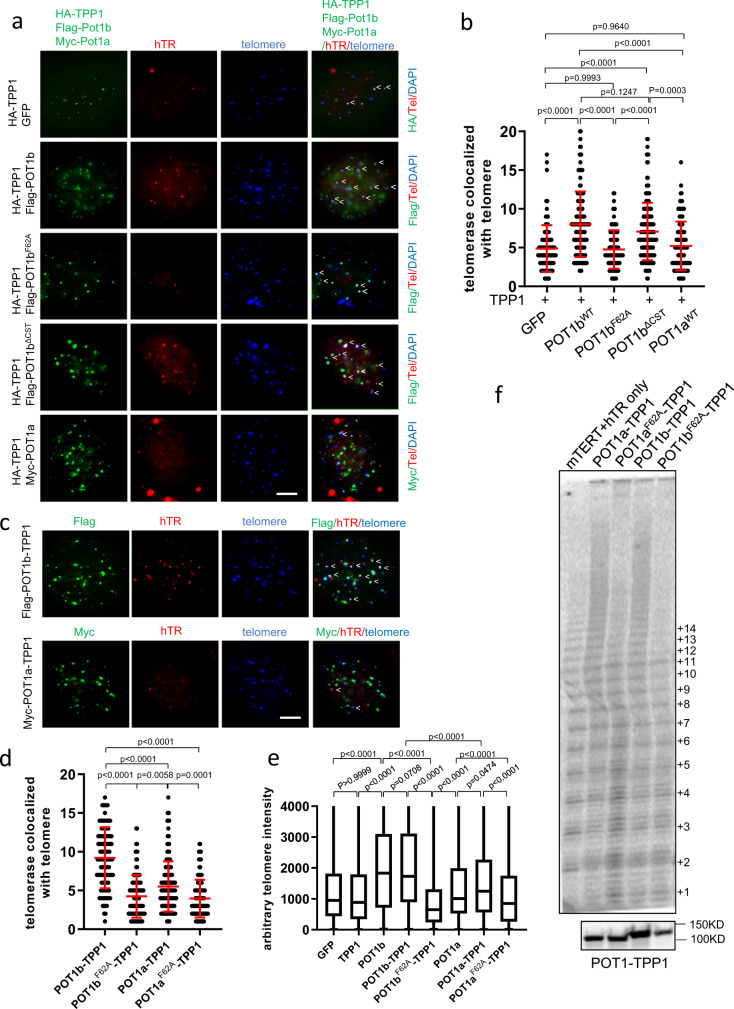
Fig. 4. POT1b promotes telomerase recruitment to telomeres.
a Co-localization of hTR, HA-mTPP1, Flag-POT1b or Myc-POT1a on telomeres in G3 Pot1b−/− sarcomas (white arrows). HA-mTPP1, Flag-POT1b or Myc-POT1a (FITC, green) were detected by immunostaining with anti-HA, anti-Flag or anti-Myc antibodies. hTR RNA was detected by hybridization with Cy5-hTR cDNA probes (red) and telomeres visualized by hybridization with PNA probe Cy3-OO-(CCCTAA)4 (blue). Scale bar: 5 µm. b Quantification of co-localization of hTR with telomeres in G3 Pot1b−/− sarcomas expressing the indicated DNAs in (a). Data show the mean ± s.d. from three independent experiments. At least 500 nuclei were analyzed per genotype. p-values are shown and generated from one-way ANOVA analysis followed by Tukey’s multiple comparison. c Co-localization of hTR with POT1b-TPP1 or POT1a-TPP1 on telomeres in G3 Pot1b−/− sarcoms (white arrows). Scale bar: 5 µm. d Quantification of co-localization of hTR with telomeres in G3 Pot1b−/− sarcomas expressing the indicated DNAs in (c). Data show the mean ± s.d. from three independent experiments. At least 500 nuclei were analyzed per genotype. p-values are shown and generated from one-way ANOVA analysis followed by Tukey’s multiple comparison. e Quantification of telomere lengths by Q-FISH in G3 Pot1b−/− sarcomas expressing the indicated DNAs. At least 30 metaphases were analyzed per genotype. Data are from three independent experiments and box plots show the interquartile range (25 to 75%) and median from three independent experiments. p-values are shown and generated from one-way ANOVA analysis followed by Tukey’s multiple comparison. f Telomerase processivity assay. 293T cells stably expressing mTERT and hTR were reconstituted with POT1a-TPP1, POT1b-TPP1 or the indicated mutants. The lysates were then subjected to a direct telomerase activity assay to examine telomerase processivity in the presence of POT1a-TPP1 or POT1b-TPP1. Bottom panel: Western blot indicating equal expression of POT1-TPP1 proteins used in the processivity assays.

