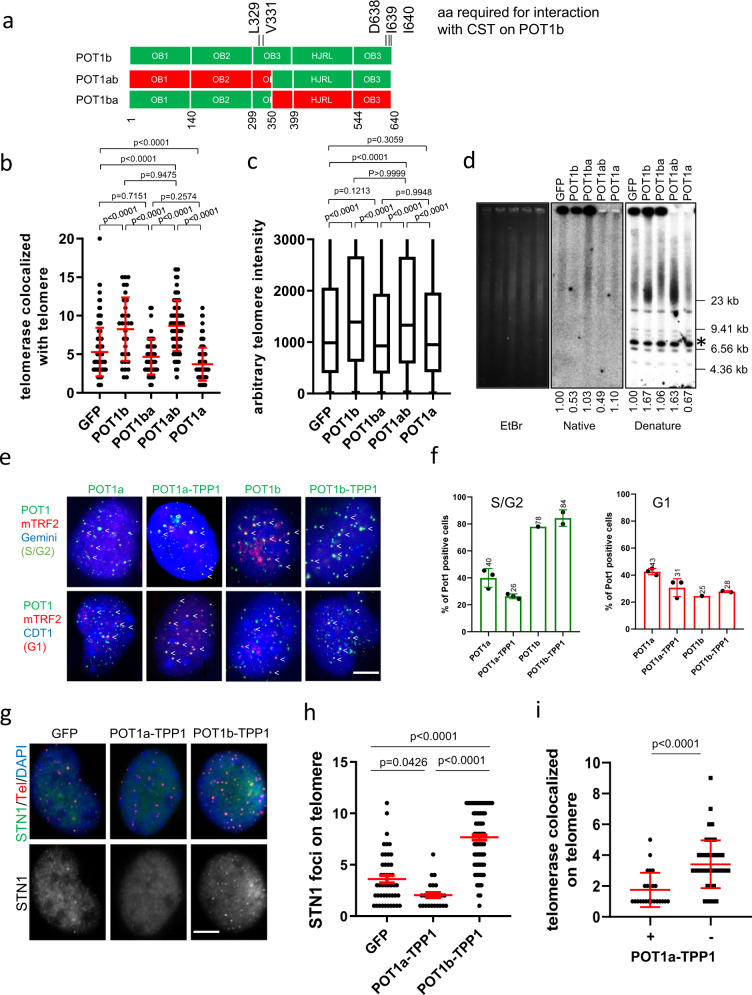
Fig. 5. The POT1b C-terminal is required for the elongation of telomere.
a Schematic of POT1b, POT1ab and POT1ba constructs. All 5 amino acids in POT1b required to interact with CTC1 are shown. b Quantification of co-localization of hTR with telomeres in G3 Pot1b−/− sarcomas expressing the indicated DNAs. Data show the mean ± s.d. from three independent experiments. p-values are shown and generated from one-way ANOVA analysis followed by Tukey’s multiple comparison. c Quantification of telomere lengths in G3 Pot1b−/− sarcomas expressing the indicated DNAs. At least 40 metaphases were analyzed per genotype. Box show the interquartile range (25 to 75%) and median from three independent experiments. p-values are shown and generated from one-way ANOVA analysis followed by Tukey’s multiple comparison. d TRF Southern blot to detect G-overhangs (native) and total telomeres (denature) in G3 Pot1b−/− sarcomas expressing the indicated DNAs. *: DNA band used for quantification. EtBr: Ethidium Bromide staining reveals equal loading of genomic DNA. Numbers indicate relative G-overhang and total telomere signals, with telomere signals set to 1.0 for cells expressing GFP. Molecular weights are indicated. e WT MEFs expressing cell-cycle sensors Geminin (blue) or CDT1 (blue) were reconstituted with the indicated POT1 proteins (green). Endogenous TRF2 marked telomeres (red). White arrows indicate POT1/TRF2 co-localization. Scale bar: 5 µm. f Localization of POT1a, POT1a-TPP1, POT1b and POT1b-TPP1 on telomeres during S/G2 (Geminin positive, left panel) and during G1 (CDT1 positive, right panel). Data show the mean ± s.d. from three independent experiments. At least 200 nuclei were analyzed for each genotype. g Endogenous STN1 localizated to telomere in wild-type MEFs expressing POT1a-TPP1 or POT1b-TPP1. STN1 was immunostained with anti-STN1 antibody (green) and telomeres were detected by PNA FISH with Cy3-OO-(CCCTAA)4 (red). Nuclei were stained with DAPI (blue). Scale bar: 5 µm. h Quantification of (g). Data show the mean ± s.d. from three independent experiments. 200 nuclei were analyzed in two independent experiments. p-values are shown and generated from one-way ANOVA analysis followed by Tukey’s multiple comparison. i POT1a-TPP1 expression represses telomerase recruitment to telomeres. Quantification of telomerase localization to telomere in WT MEFs expressing (+) POT1a-TPP1 or vector control (−). At least 200 nuclei were analyzed for each group and data show the mean ± s.d. from two independent experiments. p-values are shown and calculated from unpaired Student’s t test.

