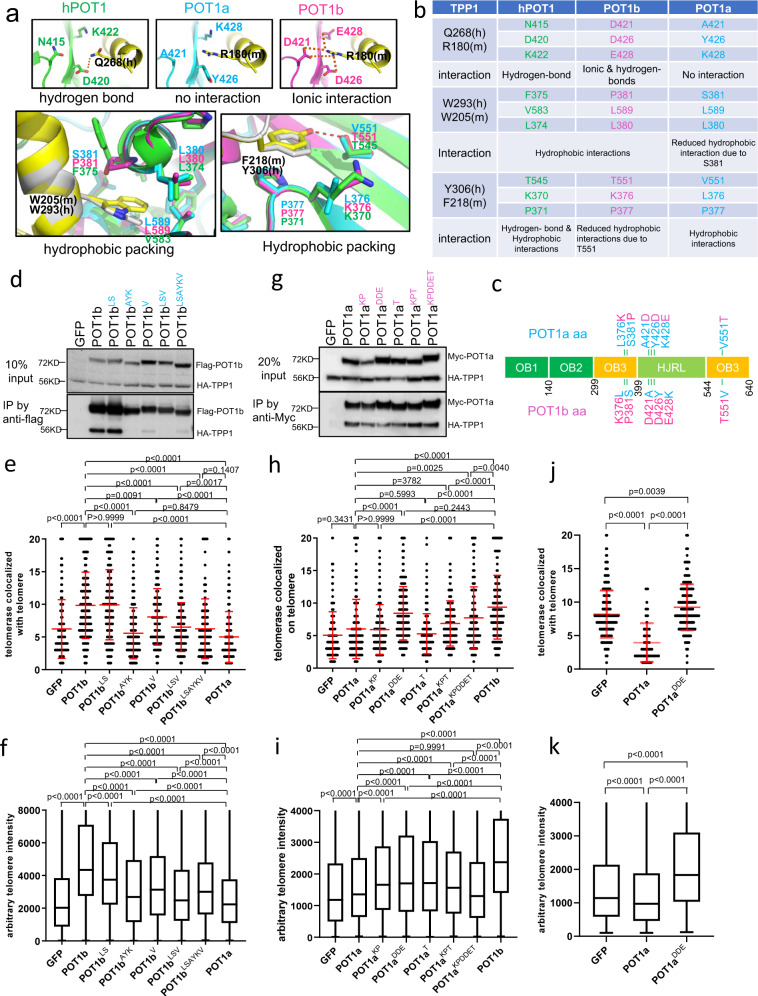
Fig. 6. Identification of unique amino acids required for POT1b dependent telomere elongation.
a Interaction interfaces between POT1 and TPP1. POT1: green; POT1a: cyan; POT1b: magenta; hTPP1/mTPP1: black. Top three panels show the POT1/POT1a/POT1b interactions around residues Q286hTPP1/R180mTPP1. The bottom left panel shows hydrophobic interactions around residues W293hTPP1/W205mTPP1, and the bottom right panel shows hydrophobic interactions around residues Y306hTPP1/F218mTPP1. b Table of amino acids from (a) predicted to form direct interactions between POT1 and TPP1. c Schematic of point mutations generated to change specific residues in POT1a or POT1b. d Co-IP assay reveal that most POT1b mutants interacts poorly with TPP1. e Quantification of co-localization of hTR with telomeres in G3 Pot1b−/− sarcomas reconstituted with the indicated POT1a and POT1b DNAs. 500 nuclei were analyzed per genotype. Data show the mean ± s.d. from three independent experiments. f Quantification of telomere lengths by Q-FISH in G3 Pot1b−/− sarcomas expressing POT1a or POT1b constructs. 30 metaphases were analyzed per construct. Box show the median and interquartile range (25% to 75%) from three independent experiments. g Co-IP assay revealed that POT1a mutants interact robustly with TPP1. h Quantification of co-localization of hTR with telomeres in G3 Pot1b−/− sarcomas reconstituted with the indicated POT1a and POT1b constructs. 500 nuclei were analyzed per genotype. Data show the mean ± s.d. from three independent experiments. i Quantification of telomere lengths by Q-FISH in G3 Pot1b−/− sarcomas expressing POT1a or POT1b DNAs. 30 metaphases were analyzed per construct. Box show the median and interquartile range (25% to 75%) from three independent experiments. j Quantification of co-localization of hTR with telomeres in MMTV-Cre; p53Δ/Δ; Pot1aΔ/Δ cells reconstituted with POT1a constructs. 500 nuclei were analyzed per genotype. Data show the mean ± s.d. from three independent experiments. k Q-FISH quantification of telomere length in MMTV-Cre; p53Δ/Δ; Pot1aΔ/Δ tumor cells reconstituted with the indicated DNAs. 40 metaphases were analyzed. Box show the median and interquartile range (25–75%) from three independent experiments. For panels (e, f, h–k), p-values are shown and generated from one-way ANOVA analysis followed by Tukey’s multiple comparison.

