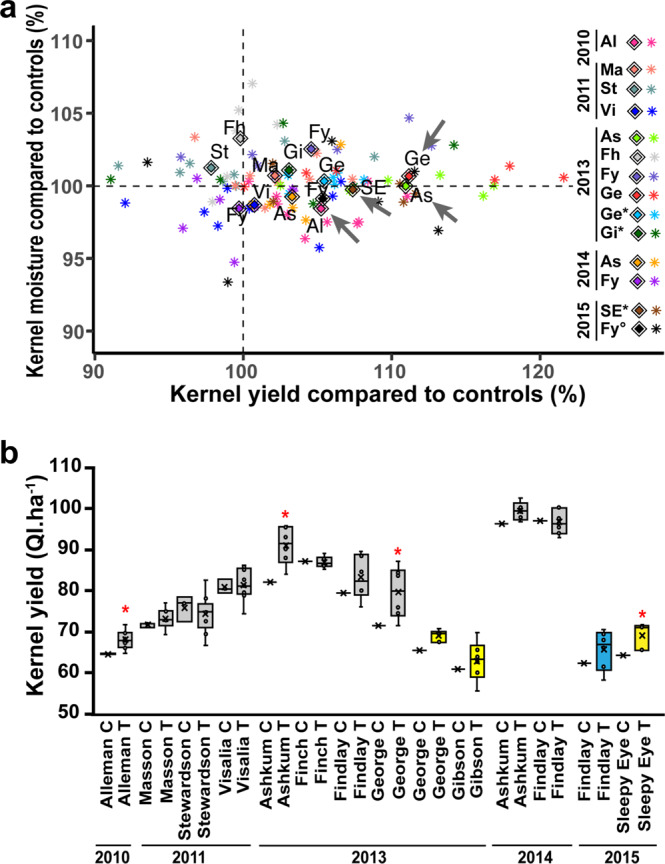
Fig. 3. Impact of Gln1-3 overexpression on kernel yield of maize hybrids grown in the field over five years in different locations.

a Relationship between kernel yield (measured in Ql. ha−1) and of kernel moisture (% compared to the control hybrids and null segregants) corresponding to the difference between the mean of all the different transgenic hybrids overexpressing Gln1-3 and the mean of the two types of control hybrids (colored diamonds). The colored asterisks represent the different transgenic events tested in the different locations over the five years of experimentation: Alleman (Al) in 2010 (pink). Masson (Ma), (orange); Stewardson (St) (green) and Visalia (Vi) (dark blue) in 2011. Ashkum (As), (light green); Finch (Fh), (light gray); Findlay (Fy), (violet); George (Ge), (red); George (Ge*),(cyan) and Gibson (Gi*), (dark green) in 2013. Ashkum (As), (yellow−orange) and Findlay (Fy), (dark purple) in 2014. Sleepy Eyes (SE*), (brown−orange) and Findlay (Fy°) (black) in 2015. Presence of a moderate water deficit in George (Ge*) and Gibson (Gi*) in 2013, Sleepy Eyes (SE*) in 2015, and water-saturated soil conditions in Findlay (Fy°) in 2015. The data are from Supplemental Data 4 in which the number of transgenic events, the years of experimentation, the locations, the experimental design, and the statistical analyses are presented. The list of different transgenic events used in the field experiments is summarized in Supplemental Data 1a. The significant increase in kernel yield in a location (p < 0.05) is indicated by a gray arrow Alleman (Al) in 2010, Askhum (As) in 2013, George (Ge) in 2013, and Sleepy Eyes (SE) in 2015. b Box plots showing details of kernel yield obtained over the five years of experimentation (2010, 2011, 2013, 2014, and 2015) in the different locations in the control hybrids (C) and in the transgenic hybrids (T). The yellow boxes indicate the presence of a moderate water deficit and the blue symbol water-saturated soil conditions. The black dots in the box represent the different transgenic events and the horizontal line in the box the average value for kernel yield. The Significant increase in kernel yield in a location (p < 0.05) is indicated by a red asterisk.
