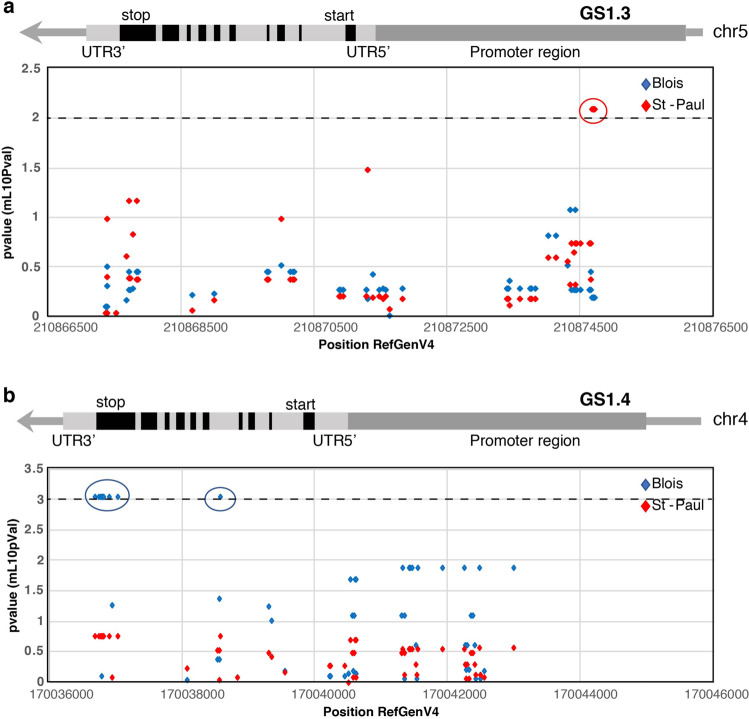
Fig. 4. Manhattan plots showing SNP association with the genes encoding Gln1-3 and Gln1-4.
Manhattan plots showing association mapping p-values associated with kernel yield at 15% moisture (KY15) and genomic location of SNPs located in gene encoding GS1.3 (a) and GS1.4 (b). Each symbol represents the p-value of a single SNP associated with a trait measured in the field trial conducted in Blois in 2015 (blue) and in Saint-Paul in 2016 (red). The horizontal dashed line represents the significant threshold with a −log10(p-value) >2 and >3 for Gln1-3 and Gln1-4 respectively. The six TAS markers (at markers C05M60, C05M61, C05M62, C05M63, C05M64, and C05M65) for Gln1-3 and the nine TAS markers (at markers C04M01, C04M02, C04M03, C04M05, C04M06, C04M07, C04M08, C04M10, and C04M15) for Gln1-4 are indicated by circles. In the upper part of the figure is indicated the position of the introns, exons, 3′ UTR, 5′ UTR, and promoter region of the two genes.

