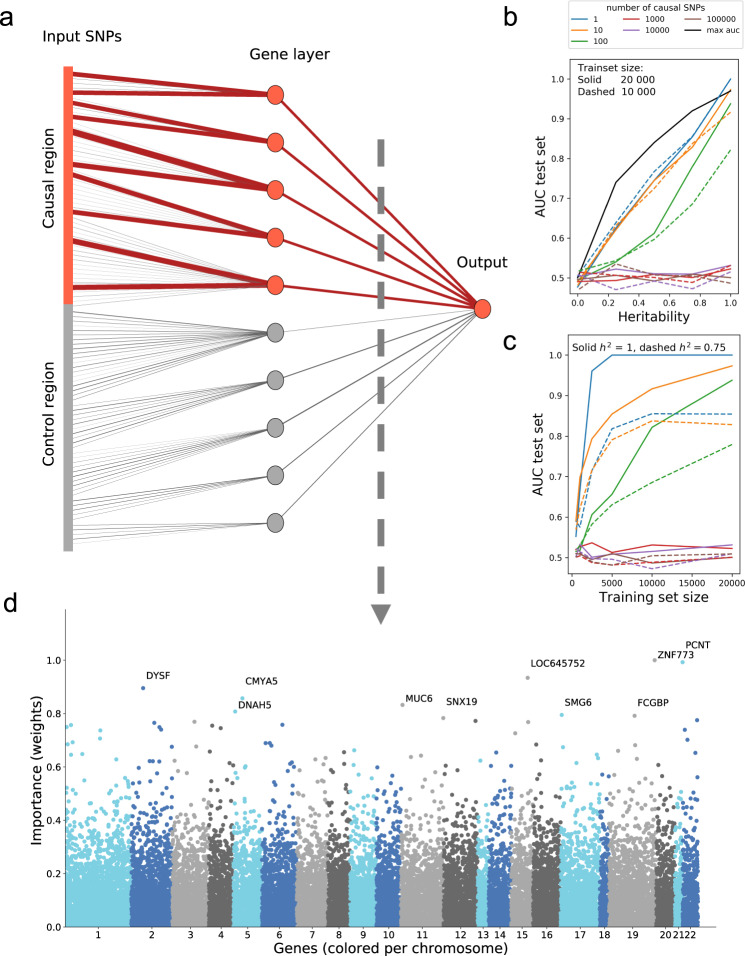
Fig. 2. Simulation results and the importance of each gene for predicting schizophrenia.
a A simple, non-linear proof of concept. In this simulation, each gene in the causal region has two causal SNPs that cause the simulated disease. The magnitude of the learned weight is represented by the line thickness (contributing causal connections in red, non-contributing control connections in gray). b A secondary set of simulations show the performance of GenNet, expressed as area under the curve, for increasing levels of heritability and training set size (c). The black curve presents the theoretical maximum of the AUC versus heritability. d Manhattan plot showing genes and their relative importance according to the network, here we have shown the results for distinguishing between schizophrenia cases and controls in the Sweden exome study. This Manhattan plot is a cross-section between the gene layer (21,390 nodes) and the outcome of a trained network with 1,288,701 input variants.

