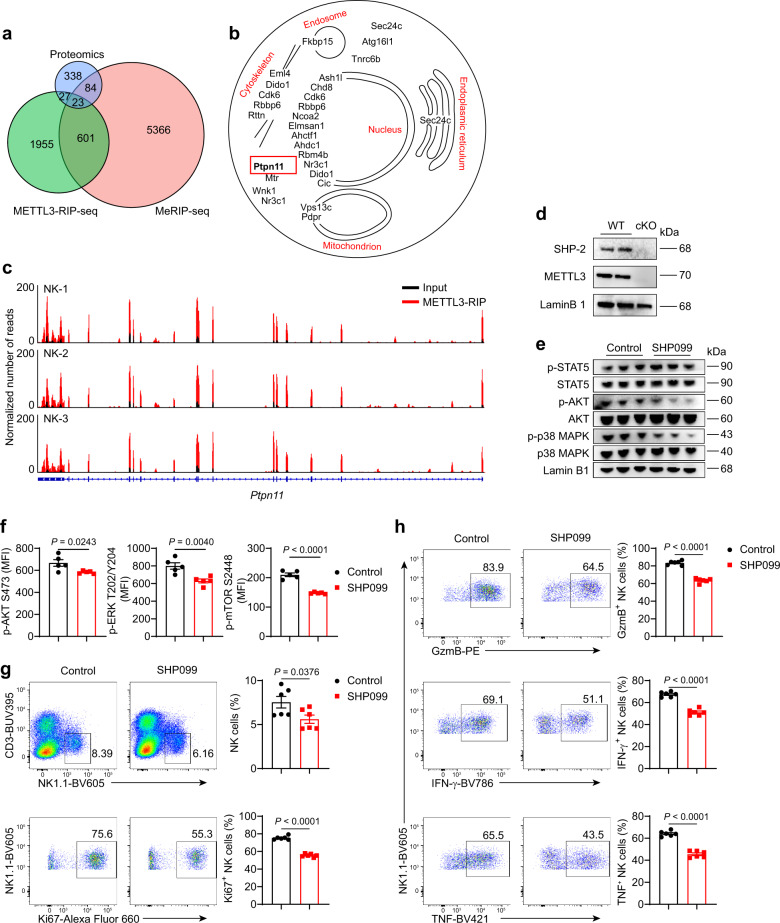
Fig. 7. METTL3-mediated m6A modification promotes SHP-2 protein expression.
a Venn diagram showing the genes or proteins modified by m6A, bound by METTL3, and affected by METTL3 deficiency. b Cellular locations of the 23 proteins in (a) using information obtained from Uniprot. c Gene track shows Ptpn11 locus as a histogram of normalized reads (y-axis) plotted by genome position (x-axis). d Immunoblotting of SHP-2 and METTL3 in purified splenic NK cells from WT and cKO mice. e Immunoblotting of indicated proteins in purified splenic NK cells after stimulated with rmIL15 (50 ng/mL) in the presence or absence of SHP099 (4 μM) for 1 h. f The splenocytes were cultured with rmIL-15 (50 ng/mL) in vitro for 3 days, followed by SHP099 (4 μM) treatment for 1 h, and then collected for flow-cytometric analyses of the indicated molecule expression in NK cells (n = 5/group). g, h Splenocytes from WT mice were stimulated with rmIL-15 (50 ng/mL) in the absence or presence of SHP099 (4 μM) for 3 days (n = 6/group). g Representative plots (left) showing the expression of CD3 and NK1.1 in cultured splenocytes or Ki67 expression in splenic NK cells; statistical graphs (right) showing the percentages of NK cells or Ki67+ NK cells. (h) Representative plots (left) and percentages (right) for the expression of GzmB, IFN-γ, TNF in splenic NK cells 4 hours after being stimulated with PMA and ionomycin. Each symbol represents an individual well of a cell culture plate (f–h). Data are the mean ± SEM (ns, not significant; unpaired two-tailed t test). Source data are provided as a Source Data file. Data represent one (f) or at least two independent experiments (d, e, g, h).

