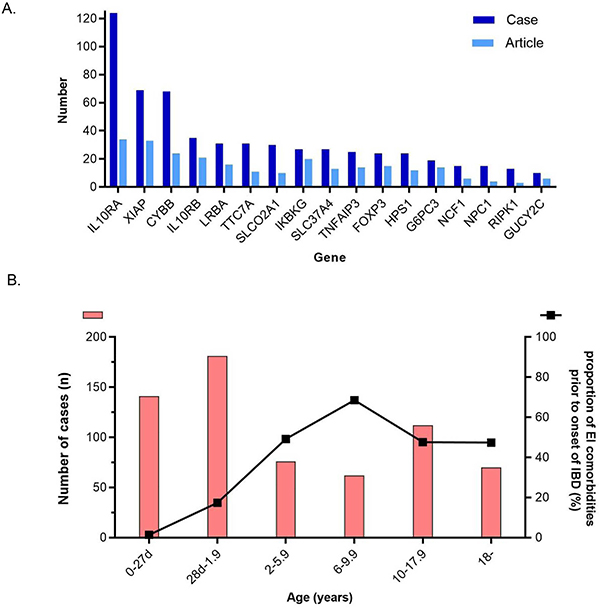
Figure 1. Common genes and age of onset of monogenic IBD.
(A) Number of reported monogenic IBD cases and articles stratified by gene. Only genes that have ten or more cases are listed. Dark blue; number of cases, Light blue; number of articles.
(B) Distribution of IBD onset age. Orange bar (left Y axis) is the number of cases in each age group. The line graph (right Y axis) is the proportion of patients with extraintestinal manifestations before onset of IBD.

