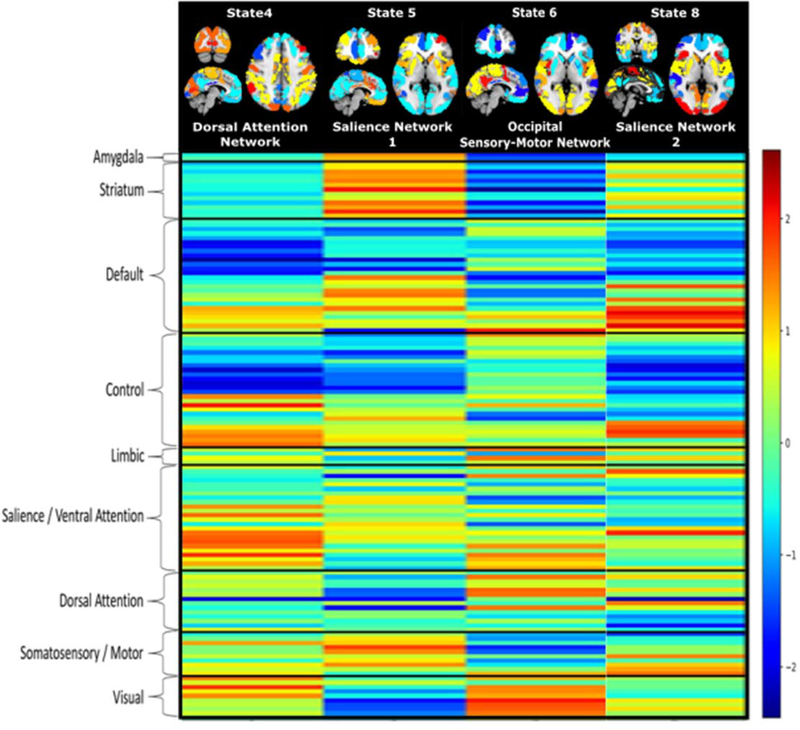
Figure 1: Transient Network States (TNSs) Displaying Sex-Related Differences in Total Time Spent in State.
Figure 1. (A) Transient Network States (TNSs) with significant sex-related differences in total time spent in each state. Warm colors represent activation while cool colors represent deactivation (relative to within-state global average). State numbers are identified at the top of the figure, while the resting state network each state spatially overlaps with is listed below the brain image. (B) Raw unnormalized representation of each state grouped by prototypical resting state network divisions. The color bar represents the relative activation (warm colors, higher activation relative to raw average) and deactivation (cool colors, lower activation relative to raw average) for each region, within each transient network state. Figure adapted, with permission, from Janes et al., 2020, under a creative commons attribution license https://creativecommons.org/licenses/by/4.0/.

