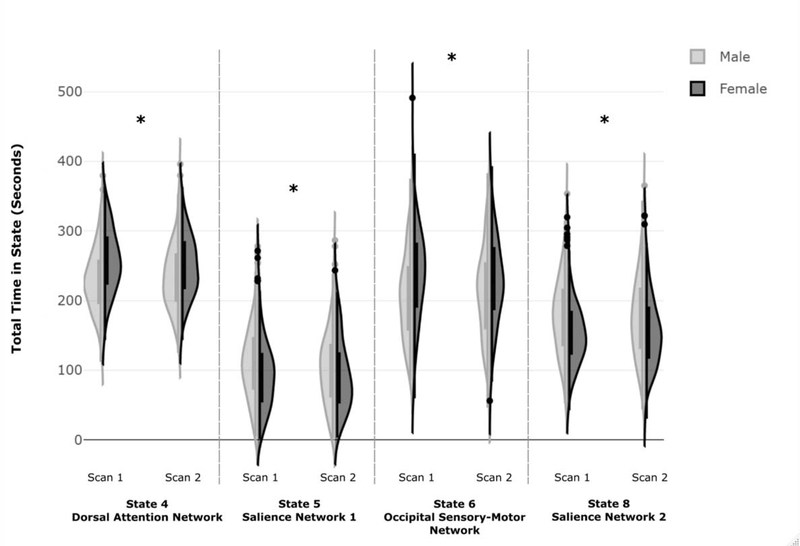
Figure 2: Sex-Related Differences in Total Time Spent in TNSs of Interest.
Figure 2. Frequency distributions of males and females for the total time spent in each TNS of interest. Females exhibited increased total time spent in States 4 and 6, whereas males exhibited increased total time spent in States 5 and 8. There were no significant sex differences in total time spent in the other four TNSs investigated. Independent samples Kolmogorov-Smirnov tests were used to examine differences in the frequency distributions between males and females (State 4: Scan 1: K-S Z=2.63, p<.001, Scan 2: K-S Z=1.63, p=.010; State 5: Scan 1: K-S Z=1.52, p=.019, Scan 2: K-S Z=1.31, p=.063; State 6: Scan 1: K-S Z=2.21, p<.001, Scan 2: K-S Z=1.16, p=.138; State 8: Scan 1: K-S Z=2.26, p<.001, Scan 2: K-S Z=1.79, p=.003).

