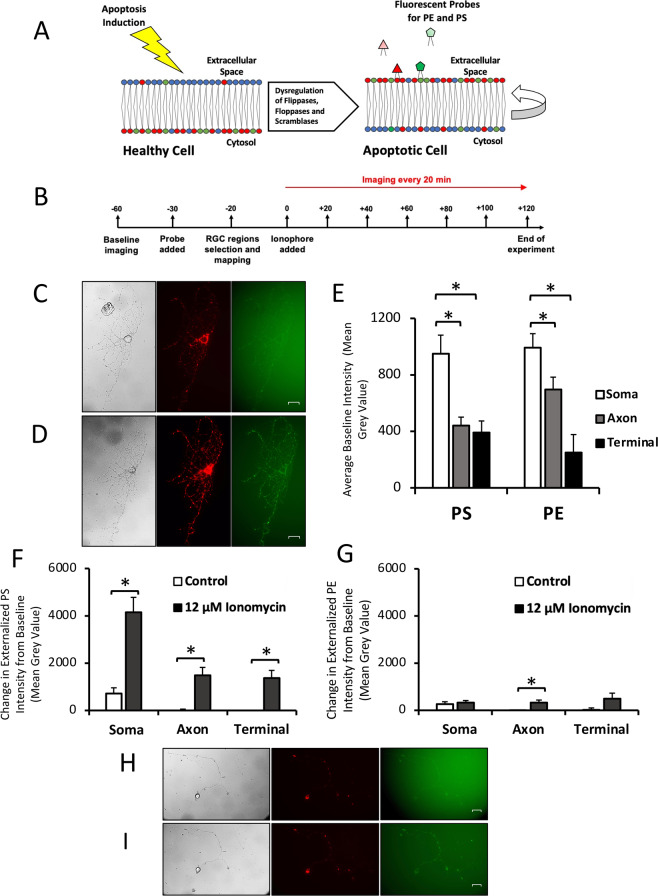
Fig. 1. Qualitative and quantitative changes in phospholipid externalization in cultured RGCs.
A Externalization of PS and PE during apoptosis. PS and PE are preferentially distributed in the inner leaflet of the plasma cell membrane of healthy cells. After apoptosis induction, membrane proteins are dysregulated, leading to externalization of PS and PE and a loss of membrane asymmetry. Externalized PS and PE are targets for imaging probes. B Timeline for cell imaging. Units are in minutes, with t = 0 the time point that ionophore or control media was added. The imaging probe mixture contained duramycin-GFP for imaging PE and annexin A5 for imaging PS. C Retinal ganglion cell before exposure to 12 uM ionomycin. Cells were in culture for 6 days prior to the experiment. Left: DIC image of cell. Middle: 670 nm image of cell, labeling PS externalization. Right: 519 nm image of cell, labeling PE externalization. D Retinal ganglion cell after 2 h exposure to 12 uM ionomycin. Left: DIC image of cell. Middle: 670 nm image of cell, labeling PS externalization. Right: 519 nm image of cell, labeling PE externalization. E Mean baseline PS and PE externalization in 20 RGCs for each cell compartment. Three measurements per cell were taken of each compartment. *p < 0.0001. F Change in PS externalization relative to baseline in 10 RGCs after 2 h exposure to 12 uM ionomycin or control media. For each cell 3 measurements were taken of each compartment. *p < 0.0001. G Change in PE externalization relative to baseline in 10 RGCs after 2 h exposure to 12 uM ionomycin or control media. For each cell 3 measurements were taken of each compartment. *p = 0.002. H Retinal ganglion cell before exposure to additional control media. Cells were in culture for 8 days prior to the experiment. Left: DIC image of cell. Middle: 670 nm image of cell, labeling PS externalization. Right: 519 nm image of cell, labeling PE externalization. I Retinal ganglion cell after 2 h exposure to additional control media. Left: DIC image of cell. Middle: 670 nm image of cell, labeling PS externalization. Right: 519 nm image of cell, labeling PE externalization. All scale bars 20 µm.

