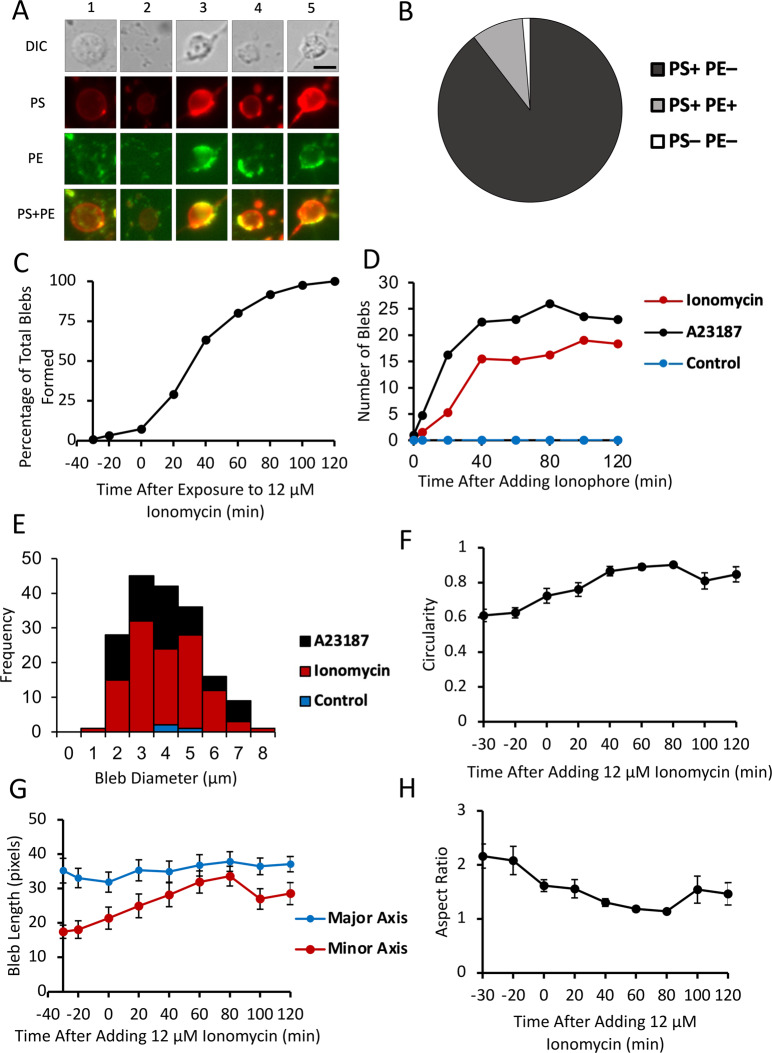
Fig. 2. Morphological characteristics, time dependence, and geometric aspects of bleb formation.
A Examples of blebs with different staining patterns. 1: PS + PE–; 2: PS + PE– Para-axonal PE + ; 3: PS + Half of Bleb PE + Para-axonal Staining + ; 4: PS + Half of Bleb PE + Para-axonal Staining–; 5: PS + PE + . Scale bar 5 µm. B Classification of all blebs (n = 220) observed in 5 cells exposed to 12 µM ionomycin, based on staining of externalized PS and PE. C Proportion of blebs formed before and after exposure to 12 µM ionomycin. D Mean number of axonal blebs in selected RGCs after addition of calcium ionophore. Number of blebs counted for four cells of each treatment. Cells were exposed to A23187, ionomycin, or control media. E Size distribution of RGC axonal blebs. Bleb diameter was measured for all blebs in 2 cells for each condition: control, ionomycin, and A23187. Measurement taken in cells after 2 h exposure to calcium ionophore or control media. Mean diameter of blebs was 3.45 μm. F Mean circularity of 10 blebs exposed to 12 uM ionomycin over time; 1 is equivalent to a perfect circle. G Mean length of 10 blebs along its major and minor axes before and after exposure to 12 µM ionomycin. H Mean aspect ratio of 10 blebs before and after exposure to 12 µM ionomycin. Aspect ratio was calculated by dividing the maximum axis by the minimum axis length.

