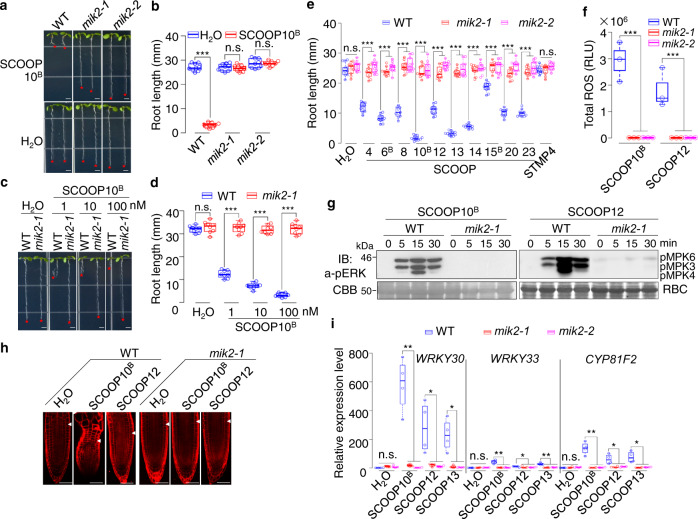
Fig. 3. SCOOP-triggered responses depend on MIK2.
a–d SCOOP10B-triggered root growth inhibition is blocked in mik2 mutants. Images of 10-day-old WT and mik2 mutant seedlings with or without 1 µM SCOOP10B (a) or different concentrations of SCOOP10B (c). Quantification of root length of seedlings is shown (b, d) (***P < 0.001, n.s., no significant differences, two-tailed Student’s t-test, n = 9 in (b), n = 8 in (d)). Scale bar, 4 mm. e The mik2 mutants block the root growth inhibition induced by different SCOOPs. Quantification of root length of 10-day-old WT and mik2 seedlings with or without 1 µM SCOOPs (***P < 0.001, n.s., no significant differences, two-tailed Student’s t-test, n = 9, plots 1–3, 5, 8–10, 12, 22–24, 27, 29, 31, 32, 36; n = 10, plots 4, 6, 7, 11, 15, 16, 18, 19, 21, 25, 30, 33; n = 8, plots 14, 17, 20, 26, 34, 35). f SCOOP12-induced ROS production is blocked in mik2 mutants. One-week-old seedlings were treated with 100 nM SCOOP10B or SCOOP12, and ROS production was calculated as total RLU (***P < 0.001, two-tailed Student’s t-test, n = 3). g SCOOP10B and SCOOP12-induced MAPK activation is blocked in mik2-1. Ten-day-old seedlings were treated with or without 1 µM SCOOP12. The MAPK activation was analyzed by immunoblotting (IB) with α-pERK1/2 antibodies. The protein loading is shown by CBB staining for RBC. h The mik2-1 mutant blocks SCOOP-induced root meristem distortion. Confocal images of root tips of 5-day-old seedlings with or without treatment of 1 µM peptides for 48 h followed by PI staining. Arrowheads indicate the boundary of the root meristem and the elongation zone. Scale bar, 50 µm. i SCOOP-induced defense gene expression is blocked in mik2 mutants. Ten-day-old seedlings were treated with or without 1 µM SCOOP10B, 12, or 13 for 1 h and subjected to RT-qPCR analysis. Expression of genes was normalized to that of UBQ10 (*P < 0.05, **P < 0.01, n.s., no significant differences, two-tailed Student’s t-test, n = 4). The box plots in (b), (d), (e), (f), and (i) show the first and third quartiles as bounds of box, split by the medians (lines), with whiskers extending 1.5-fold interquartile range beyond the box, and minima and maxima as error bar. The experiments in (a–d), (f), (h), and (i) were repeated three times, and (e) and (g) twice with similar results.

