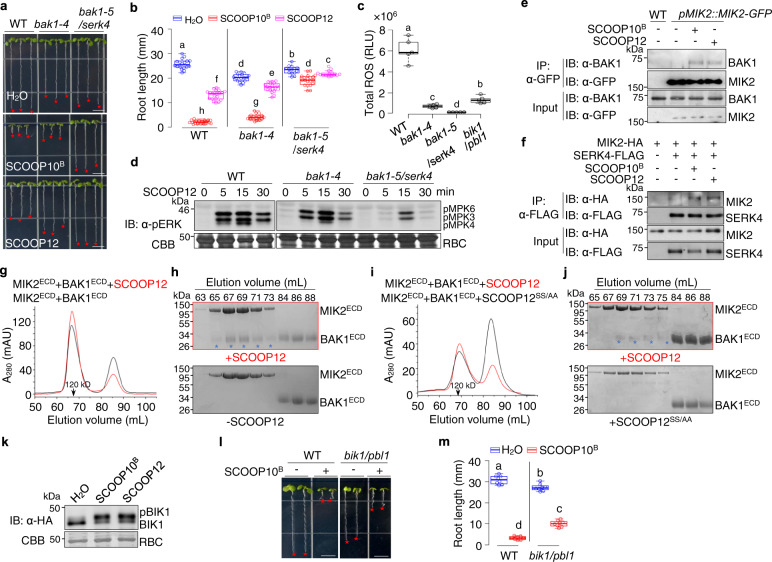
Fig. 5. SCOOPs induce MIK2-BAK1/SERK4 complex formation and relay signaling through BIK1 and PBL1.
a, b SCOOP-triggered root growth inhibition is compromised in bak1-4 and bak1-5/serk4. Images of 10-day-old seedlings with or without 1 µM SCOOP10B or SCOOP12. Scale bar, 4 mm (a). Quantification of root length (b). c SCOOP12-induced ROS is compromised in bak1-4, bak1-5/serk4, and bik1/pbl1. One-week-old seedlings were treated with 100 nM SCOOP12, and ROS production was calculated as total RLUs. d SCOOP12-induced MAPK activation is compromised in bak1-4 and bak1-5/serk4. The assay was done as in Fig. 3g. e SCOOPs induce MIK2-BAK1 association. Leaves of pMIK2::MIK2-GFP/mik2-1 plants were treated with or without 1 μM SCOOPs for 30 min. Total proteins were subjected for immunoprecipitation (IP) with α-GFP agarose beads, and the immunoprecipitated proteins were detected with α-BAK1 or α-GFP antibodies (top two). The input controls before IP are shown on the bottom two panels. f SCOOPs induce MIK2-SERK4 association. Protoplasts expressing MIK2-HA and SERK4-FLAG, or a control vector (Ctrl) were treated with or without 1 μM SCOOPs for 15 min. IP and IB were performed as (e). g, h SCOOP12 induces MIK2ECD-BAK1ECD interaction. Gel filtration chromatography analysis using MIK2ECD and BAK1ECD shows the elution profiles in the presence (red) or absence (black) of 0.1 mg SCOOP12 (g). SDS-PAGE and CBB staining show the eluted fractions (top panel with SCOOP12; bottom panel without SCOOP12). Stars indicate the eluted BAK1ECD complexing with MIK2ECD (h). i, j SCOOP12SS/AA does not induce MIK2ECD-BAK1ECD interaction. Experiments were performed as in (g) and (h). k SCOOPs induce BIK1 phosphorylation. Protoplasts expressing BIK1-HA were treated with 1 μM SCOOP10B or SCOOP12 for 15 min. Proteins were subjected to IB using α-HA antibodies (top), and CBB staining for RBC as loading controls (bottom). Phosphorylated BIK1 (pBIK1) was indicated as a band mobility shift. l, m SCOOP10B-triggered root growth inhibition is compromised in bik1/pbl1. Images of 10-day-old seedlings with or without 1 µM SCOOP10B. Scale bar, 4 mm (l). Quantification of root length (m). The box plots in (b), (c), and (m) show the first and third quartiles as bounds of box, split by the medians (lines), with whiskers extending 1.5-fold interquartile range beyond the box, and minima and maxima as error bar. A significant difference is shown between different letters (P < 0.05, one-way ANOVA followed by Tukey’s test, n = 15, b, 5, c, and 8, m). Experiments in (a–d), (l), and (m) were repeated three times and (e–k) twice with similar results.

